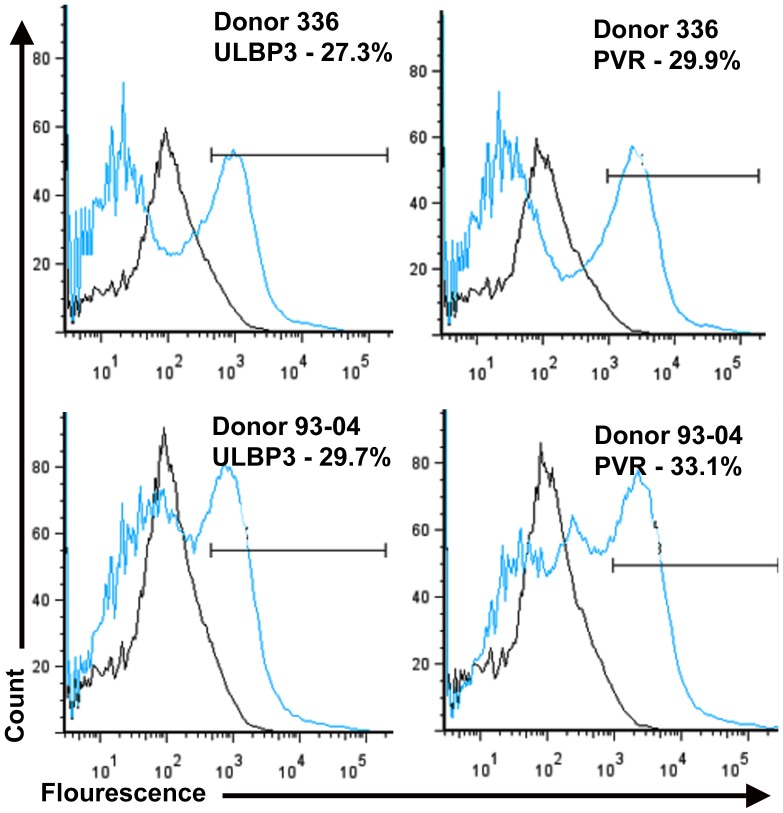
Figure 10. MSC donor populations express ligands that induce NK receptor activation.
Flow cytometric analysis of MSC donor populations 93-04 and 336-03 stained with an isotype control (gray line) or antibodies specific for ULBP3 and PVR (blue line). Indicated is the percentage of cells immuno-reactive against each respective antibody.

