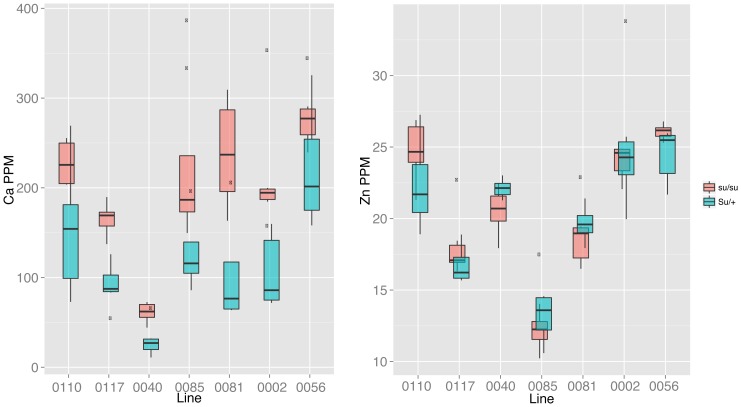
Figure 3. Alphabox plots of the effect of su on Ca and Zn accumulation.
Five number summaries (median, 1st and 3rd quartiles, and 1.5 interquartile range) are shown of each seed type. Salmon denotes the values for the su/su (collapsed) seed, while teal denotes the values for Su/+ (plump) alleles. Outliers beyond 1.5 IQR are shown as black dots. Line names are the entry numbers in the Panzea database for the B73 x IL14H (Z011) population.

