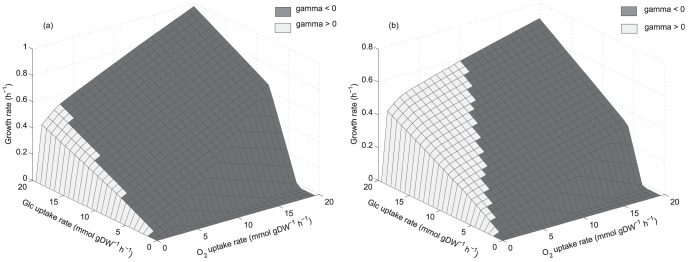
Figure 5. Phenotypic phase planes showing reducing capacity availability patterns for S. stipitis considering a priori deletions.

(a): NDH1/AOX double-deletion. (b): COX single-deletion.  :
:  , shadow price for available reducing capacity (Eq. 2). Phase planes are shaded showing where
  is positive or negative. Glc: glucose.
