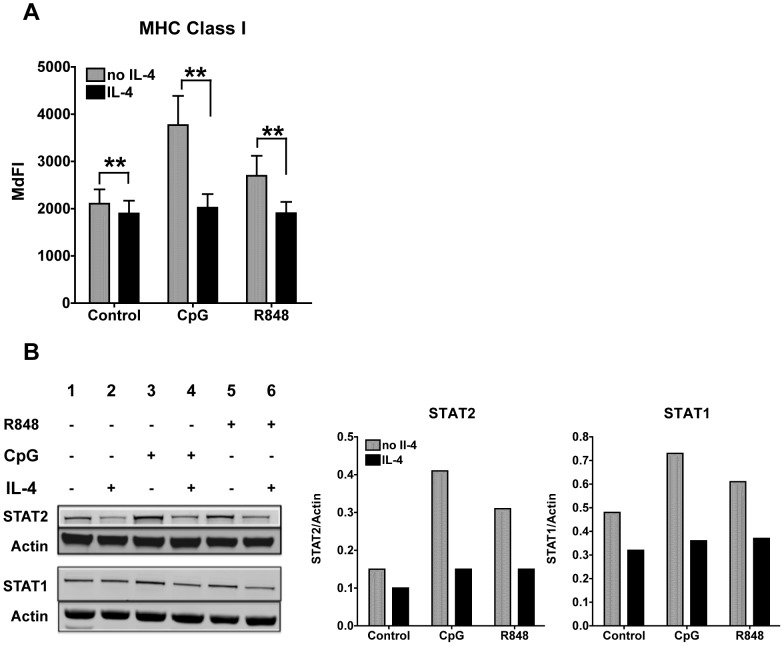
Figure 3. IL-4 suppresses expression of TLR7- and 9-induced MHC Class I, STAT1 and STAT2 protein expression.
A. We treated cDCs with IL-4 or left them untreated for 24 h. We then stimulated the cDCs with CpG or R848 for 24 h and then analyzed MHC class I expression. Histogram bars represent averages and standard errors (SE) of the median fluorescence intensity (MdFI) of seven experiments conducted with seven independent cDC cultures; *p<0.05,**p<0.01. B. Western Blot analyses of STAT2 and STAT1 expression in cDCs treated or not IL-4 for 24 h and then stimulated for 8 h with 10 ug/ml of CpG 1826 or 1 ug/ml of R848. Actin was used as loading control. We show a representative blot of three independent experiments. Bar graph represents the ratio of integrated density values of STAT1 or STAT2 vs Actin (loading control).

