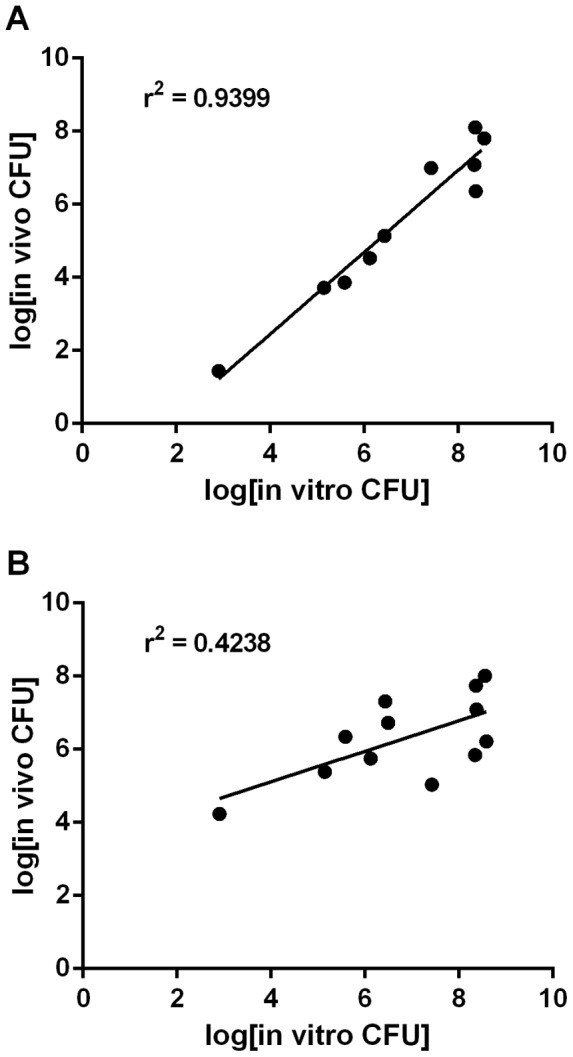
Figure 5. Correlation between in vitro and in vivo survival.

The log10 of the geometric mean number of CFU that survived in vitro challenge at pH 3.0 for 2 h was plotted against the log10 of the geometric mean number of CFU recovered from the intestinal tissue in the (A) histamine mouse model or (B) fasted mouse model. Linear regression was performed on each data set and the r2 value of the best-fit line is depicted for each model.
