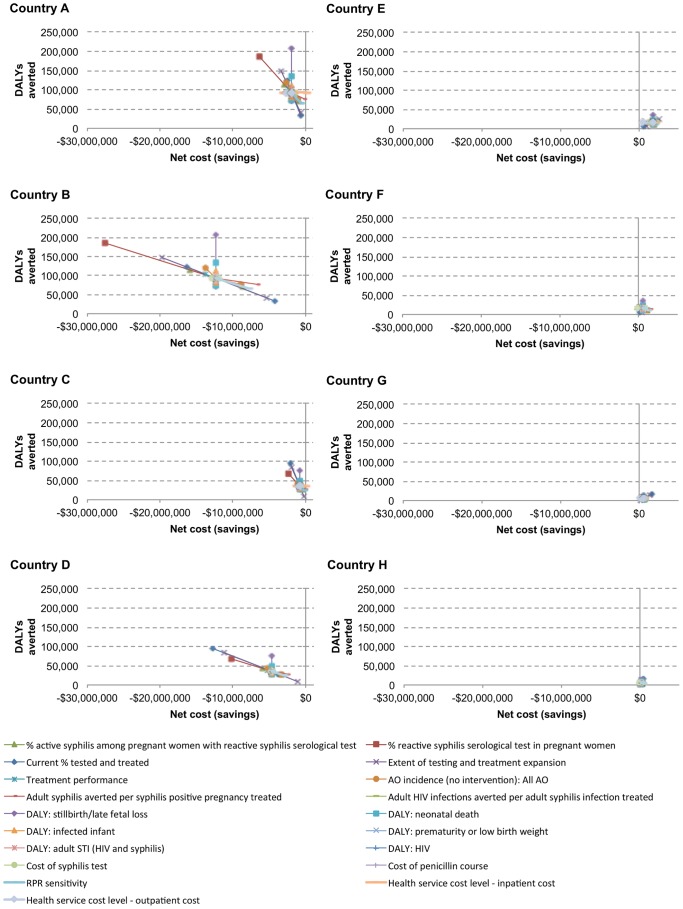
Figure 1. Sensitivity of net cost and DALYs averted to uncertainty in 20 key inputs.
Costs are in 2010 USD. Eight country scenarios (A–H) are represented in panels. Scenarios A–D are high syphilis prevalence (3% in the base case), and scenarios E–H are low syphilis prevalence (0.5% in the base case). In scenarios A–D, the intervention remains cost saving across almost all sensitivity analysis values. In scenarios E–H, the intervention remains at least highly cost-effective across all input variations.

