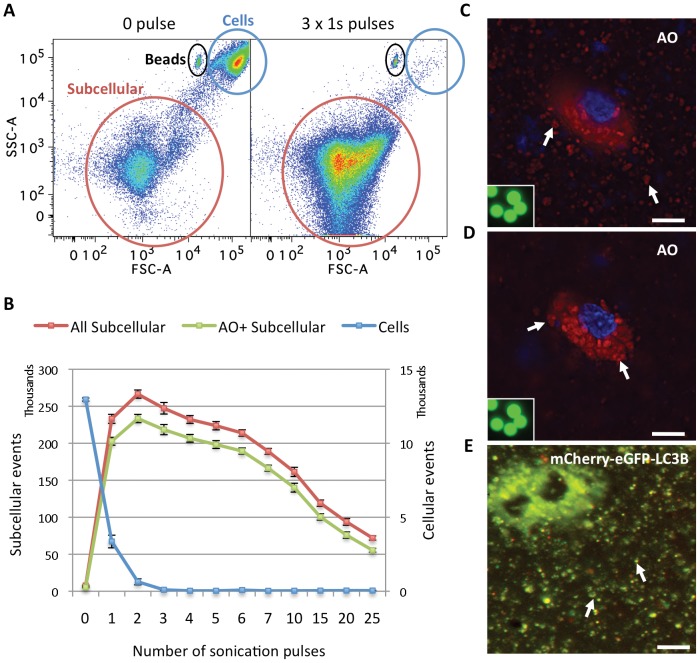
Figure 1. Sonication efficiently disrupted cells and released AVs that retained their integrity.
(A) Forward scatter (FSC) vs. side scatter (SSC) plots of flow cytometric analysis of PC3 cell homogenates after a 2-day treatment with 1 µM GDC-0941 and 10 µM CQ, stained with AO and subjected to 0 (left) or 3 (right) 1s pulses of sonication. The position of the beads (7 µm) used as a standard for size threshold to distinguish cells from subcellular structures is circled in black. The distinct low FSC and SSC population circled in red, containing cell debris and organelles, is named the “subcellular” population, and used as such throughout this report. The high FCS and SSC population of intact cells is circled in blue. (B) Quantitative analysis of the number of total and AO+ subcellular events or cells in the corresponding populations defined in (A) as a function of the number of 1s sonication pulses. Error bars represent standard errors of mean (SEM), n = 7. Representative data from 2 independent experiments are shown. (C,D) Microscopy images of PC3 cells stained with AO and Hoechst 33342 and sonicated with 3 x 1s pulses showing the bottom focus plane with released vacuoles in focus (C) and the mid-cell range focus plane with an unbroken cell in focus (D). RGB images obtained in ex FITC/em Cy5 and ex DAPI/em DAPI channels are merged using Adobe Photoshop. Inset: 7 µm beads in the green (em FITC/ex FITC) channel under microscope at the same magnification. Examples of AVs are indicated with white arrows. Scale bars: 20 µm. (E) Microscopy image of PC3 cells stably expressing mCherry-eGFP-LC3B co-treated with 1 µM GDC-0941 and 10 µM CQ for 2 days and sonicated with 3 x 1s pulses. Two unbroken cells in the upper left corner filled with AVs are out of focus. Mostly “yellow” (“red” and “green” dual positive) AVs on the bottom of the plate are in focus. RGB images from red (mCherry) and green (eGFP) channels are merged using Adobe Photoshop. Examples of AVs are indicated with white arrows. Scale bar: 20 µm.

