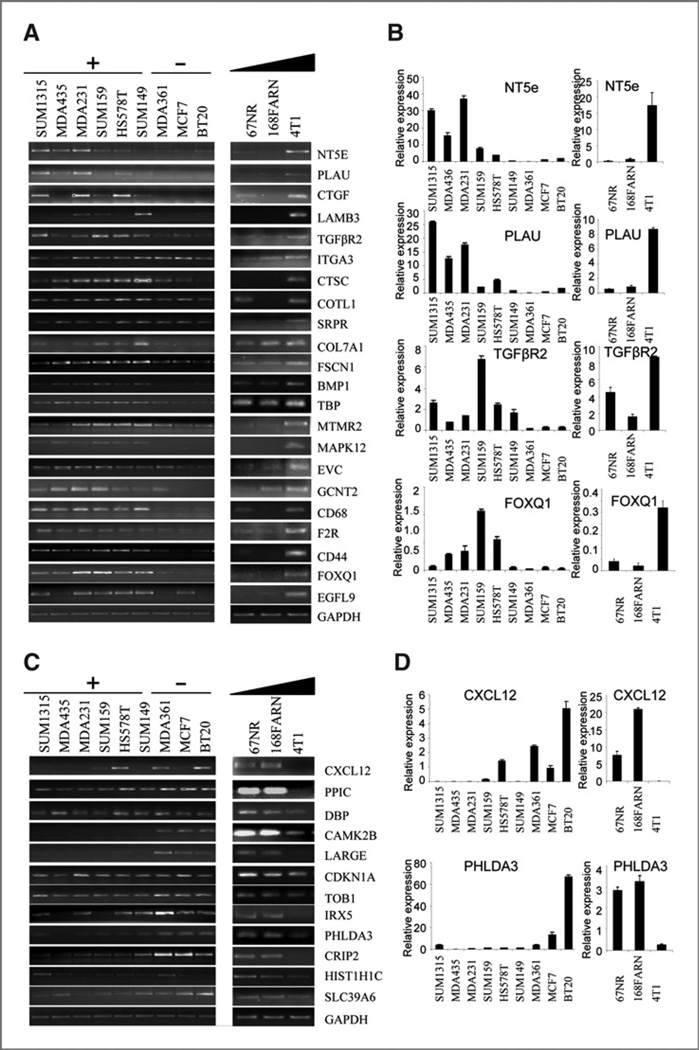
Figure 2.
Confirmation of the microarray results. RT-PCR and quantitative real-time RT-PCR results show the expression pattern of up-regulated genes (A and B) and down-regulated genes (C and D) in a panel of human breast cancer cells (A and C left panels) and mouse model cell lines (A and C right panels). Gene names are shown to the right of the panels. GAPDH is used as an RNA loading control. +, highly metastatic; −, poorly metastatic. The triangular bar indicates the increase of metastasis. Panels B and D show quantitative real-time RT-PCR results for selected genes.

