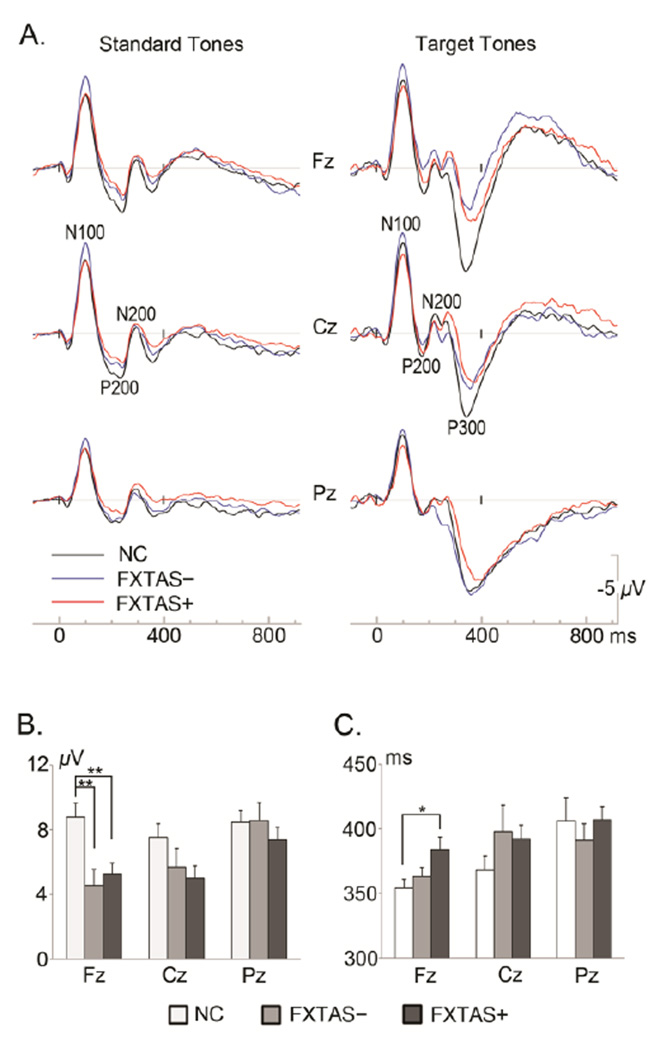
Figure 1.
Grand-average ERP waveforms elicited by standard tones and correct target tones (A). Bar graphs show P3 peak amplitude (B) and peak latency (C) at 3 midline electrodes with significant group differences at the frontal site indicated (*p = 0.027, ** p < 0.01). Error bars = standard errors, NC = Normal Controls, FXTAS− = female premutation carriers without FXTAS, FXTAS+ = female premutation carriers with FXTAS.

