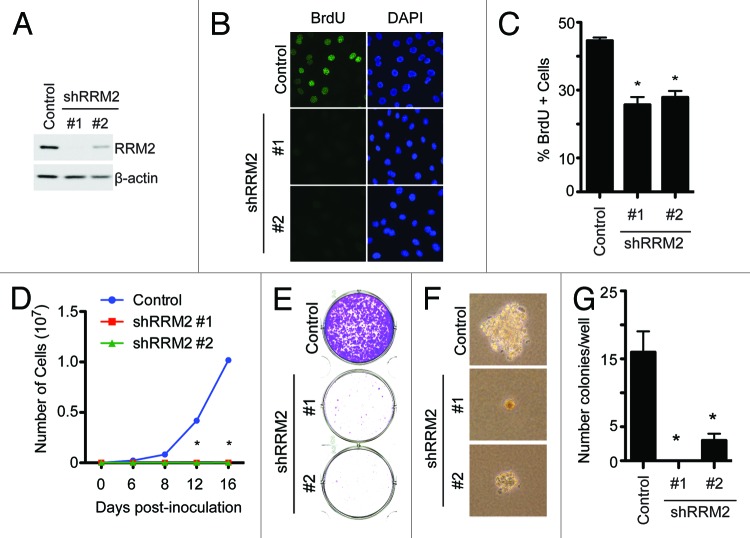
Figure 3. Knockdown of RRM2 inhibits cell growth and proliferation of EOC cells. (A) SKOV3 EOC cells were infected with control or 2 individual shRRM2-encoding lentivirus and selected with 3 μg/ml puromycin. The expression of RRM2 was determined in drug-selected cells by immunoblotting. β-actin was used as a loading control. (B) Same as (A) but labeled with 10 μM BrdU for 30 min to identify the cells that are actively undergoing DNA replication, and the incorporated BrdU was visualized by immunofluorescence staining. DAPI counterstaining was used to visualize cell nuclei. (C) Quantification of (B) 200 cells from each of the indicated groups were examined for BrdU incorporation. Mean of 3 independent experiments with SEM *P < 0.01 compared with controls. (D) Same as (A) but an equal number of cells (3000 cells/well) were seeded in 6-well plates, and the number of cells was counted at the indicated time points. Mean of 3 independent experiments with SD *P < 0.05 compared with controls. (E) Same as (D), but after 2 weeks of culture the plates were stained with 0.05% crystal violet in PBS to visualize focus formation. Shown are representative images of 3 independent experiments. (F) Same as (D), but cells were seeded into soft agar, and 2 weeks later, the colonies were visualized with bright field fluorescence. Shown are representative images of 3 independent experiments. (G) Quantification of (F). Colonies were stained with 1% crystal violet and counted. Mean of 3 independent experiments with SEM *P < 0.05 compared with controls.

An official website of the United States government
Here's how you know
Official websites use .gov
A
.gov website belongs to an official
government organization in the United States.
Secure .gov websites use HTTPS
A lock (
) or https:// means you've safely
connected to the .gov website. Share sensitive
information only on official, secure websites.
