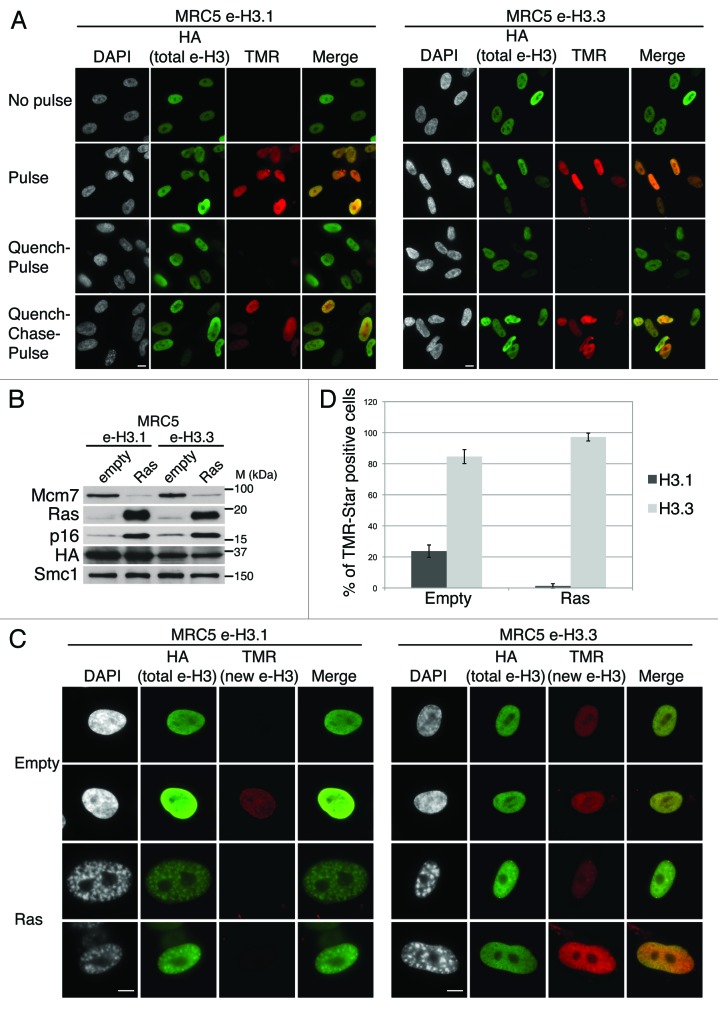
Figure 1.
Dynamics of H3.1 and H3.3 deposition in proliferating and senescent human cells. (A) Fluorescent microscopy visualization of H3.1- and H3.3-SNAP-HAx3 after in vivo labeling assays of MRC5 human primary cells with red fluorescent TMR-Star in pulse, quench–pulse, and quench–chase–pulse experiments. The pulse labels pre-existing H3-SNAP, the quench-pulse quenches pre-existing H3-SNAP with nonfluorescent block preventing their subsequent labeling with TMR-Star (background), and the quench–chase–pulse labels new H3-SNAP synthesized during the 3h30 chase. In all cases, HA stains total histone H3. DAPI stains nuclei. Scale bar is 10 μm. (See also Fig.S1). (B) Western blot analysis of whole cell extracts from MRC5 stably expressing H3.1- or H3.3 SNAP-HAx3 (e-H3.1 and e-H3.3, respectively) and transduced with an empty retroviral vector (empty) or with a vector expressing H-RasV12 (Ras) for 10 d. 25 μg of protein extracts were loaded. HA and Ras stainings verified expression of the transduced proteins. Mcm7 was used as a marker for cell proliferation and p16 as a marker for proliferation arrest. Smc-1 served as a loading control. M, molecular weight marker. (See also Fig.S2A–C). (C) Fluorescent microscopy visualization of new H3.1 and H3.3 (TMR, red) after in vivo labeling of MRC5 e-H3.1 and e-H3.3 treated as in (B) in a quench–chase–pulse experiment. HA (green) stains total H3 histones and DAPI stains nuclei. Scale bar is 10 μm. (See also Fig.S2D). (D) Histogram shows quantitative analysis of the proportion of TMR-positive cells in MRC5 e-H3.1 or e-H3.3 proliferating (empty) and senescent (Ras) cells. Numbers represent the mean of 3 independent experiments ± s.d.

