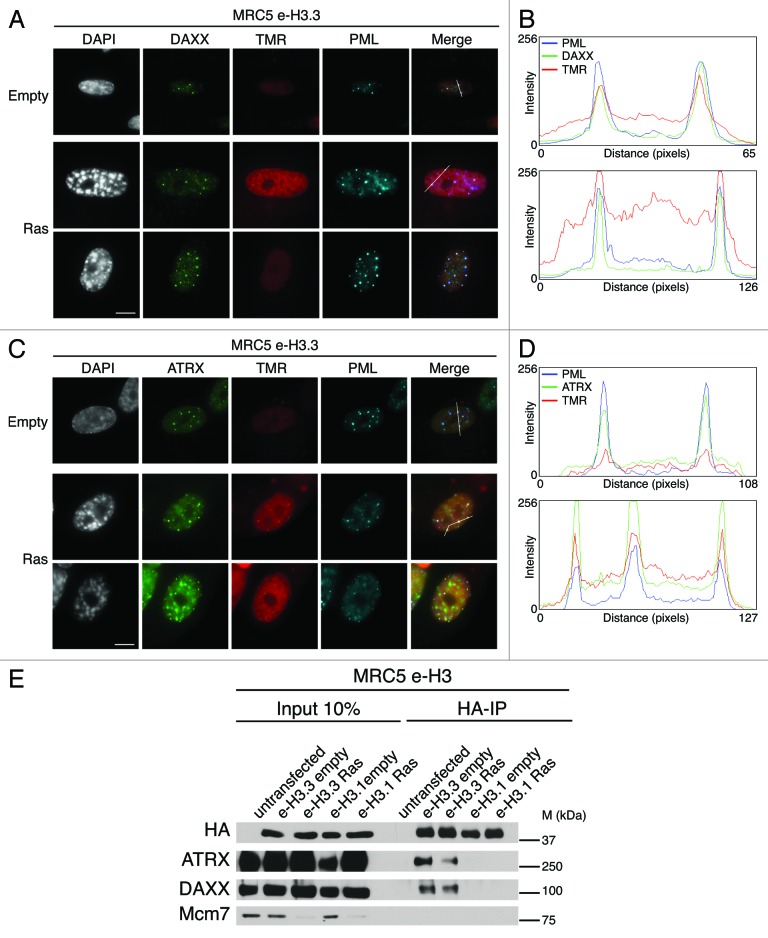
Figure 3.
New H3.3 localizes in PML-NBs together with DAXX and ATRX in proliferating and senescent cells. (A) Fluorescent microscopy visualization of new H3.3 (TMR, red) after in vivo labeling of proliferating (empty) or senescent (Ras) MRC5 e-H3.3 cells in a quench–chase–pulse experiment. Co-staining with DAXX (green) and PML (cyan, pseudo-color) shows colocalization of new H3.3 with its chaperone DAXX in PML-NBs. Merge images represent PML in blue, DAXX in green, and new H3.3 (TMR) in red. Scale bar is 10 μm. (See also Fig.S4AandB). (B) Graphics show fluorescent intensity profiles quantified using ImageJ along lines drawn through nuclei as shown in (A). (C) Fluorescent microscopy visualization of new H3.3 (TMR, red) after in vivo labeling of MRC5 e-H3.3 cells treated as in (A) in a quench–chase–pulse experiment. Co-staining with ATRX (green) and PML (cyan, pseudo-color) shows colocalization of new H3.3 with its chaperone ATRX in PML-NBs. Merge images represent PML in blue, ATRX in green, and new H3.3 (TMR) in red. Scale bar is 10 μm. (D) Graphics show fluorescent intensity profiles quantified by ImageJ along lines drawn through nuclei as shown in (C). (E) Immunoprecipitation performed against HA tag on 150 μg of nuclear cell extracts from regular MRC5 cells (negative control) or MRC5 e-H3.1 or e-H3.3. Cells were either proliferating (empty) or induced into senescence by overexpression H-RasV12 (Ras) for 8 d. Input is 10% of the immunoprecipitated material. Membranes were probed for HA as a control for IP, for Mcm7 as a marker of cell proliferation and negative control for IP, and for DAXX and ATRX. M, molecular weight marker.

