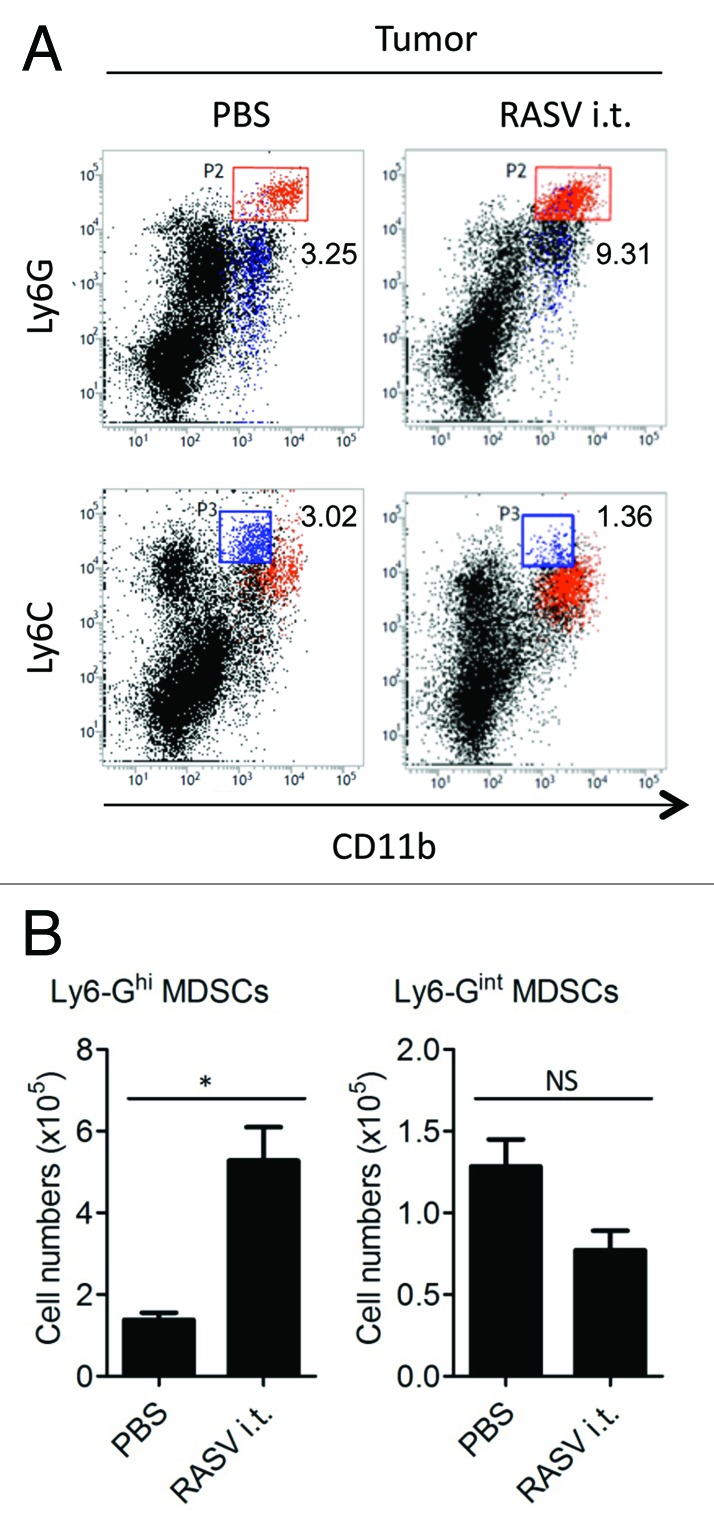
Figure 1. RASV increased Ly6-Ghigh MDSCs in the tumor. Two subsets of MDSCs were evident, Ly6-GhighLy6-Cinter cells (upper panel) and Ly6-G interLy6-Chigh cells (lower panel). (A) FACS plot percentages and (B) absolute number of each MDSC subset in the tumor. *p < 0.05. Adapted from Hong et al.15
