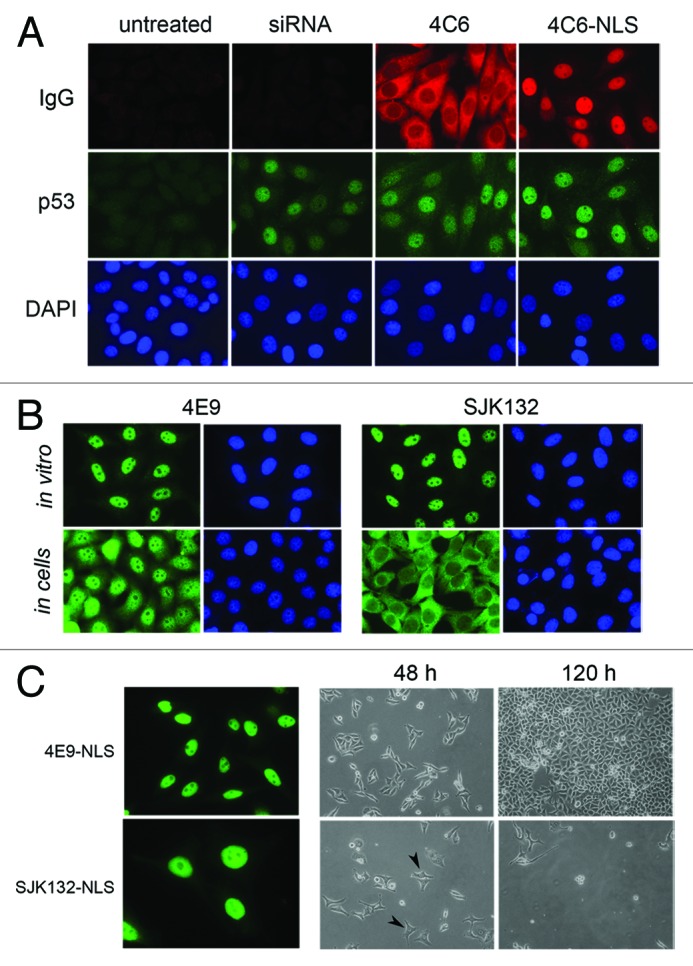
Figure 2. Biological effect of delivered anti-E6 and anti-DNA polymerase α antibodies. (A) Micrographs of typical CaSki cells following transfection with anti-E6 siRNA or transduction with 4C6 antibody. At 48 h post-treatment, the 4C6 antibodies were revealed with Alexa 568-labeled goat anti-mouse immunoglobulins, in parallel with p53 as indicated in the method section. Magnification: 630 × . (B) Micrographs of HeLa cells either stained by indirect immunofluorescence (in vitro) or after transduction at 48 h (in cells) with the indicated antibody. The monoclonal antibodies were detected as indicated in the legend of Figure 1. Magnification: 630 × . (C) The panels on the left represent typical HeLa cells after transduction of 4E9-NLS and SJK123-NLS conjugates and stained with Alexa 488-labeled goat anti-mouse immunoglobulins as in B (in cells). Magnification: 630 × . The micrographs on the right represent typical fields of cells after 2 or 5 d post-treatment with each conjugate observed under the optical microscope. Typical enlarged nuclei are ticked with black arrows. Magnification: 200 × .
