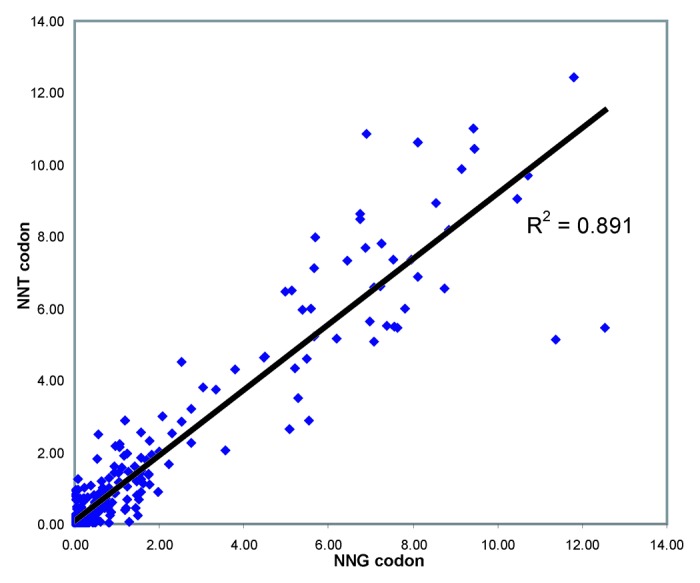
Figure 3. ER correlation for synonymous codon pairs. Scatter plot showing enrichment ratios for 398 synonymous NNT/NNG codon pairs encoding Ala, Gly, Leu, Pro, Arg, Ser, Thr and Val substitutions,. ER for the NNG codon is shown on the X axis, ER for the corresponding NNT codon is shown on the Y axis.
