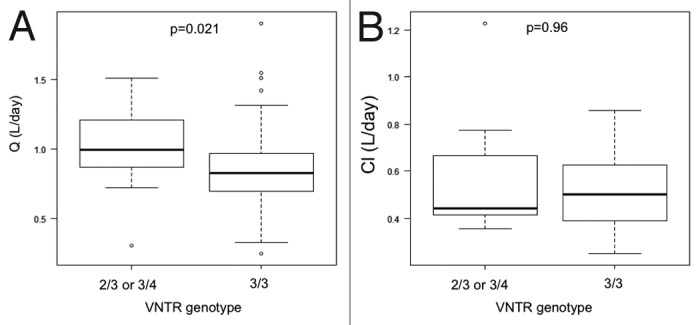
Figure 1. Comparison of cetuximab distribution (Q) and elimination (Cl) clearances according to patients VNTR genotype. Box-plot representation in the two genotypes of distribution clearance (Q) in (A) and elimination clearance (Cl) in (B). Medians, first and third quartiles and 5 and 95 percentiles are represented. Isolated circles are extreme values.
