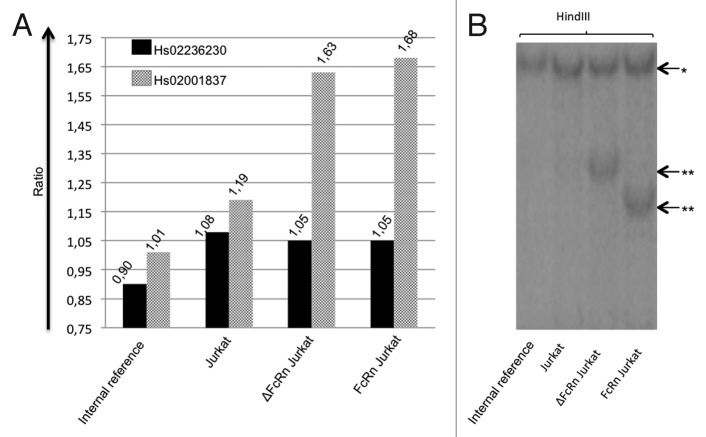
Figure 3. Affect of a supplemental coding sequence of FCGRT on PCR ratios. (A) Results of real-time PCR with Hs02236230 (black bars) and Hs02001837 (gray bars). Ratio values are indicated above respective bars. (B) Southern blot analysis following HindIII digestion of corresponding DNA samples. * Bands of identical size corresponding to endogenous FCGRT. ** bands only present in FcRn Jurkat or ΔFcRn Jurkat DNA samples lane corresponding to FCGRT additional insertion.

An official website of the United States government
Here's how you know
Official websites use .gov
A
.gov website belongs to an official
government organization in the United States.
Secure .gov websites use HTTPS
A lock (
) or https:// means you've safely
connected to the .gov website. Share sensitive
information only on official, secure websites.
