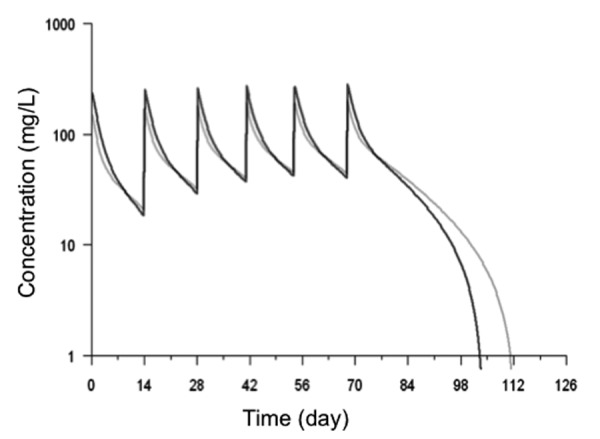
Figure 4. Cetuximab concentrations measured in the patient with 3 copies of FCGRT and mean cetuximab concentration in 93 other patients. Model-predicted concentrations, using the estimated pharmacokinetic parameters, are displayed. Black profile corresponds to the PKs of cetuximab when parameters of patient with 3 copies of FCGRT are used in the model. Grey profile corresponds to the PKs of cetuximab using the mean parameters of 93 patients in the same model.
