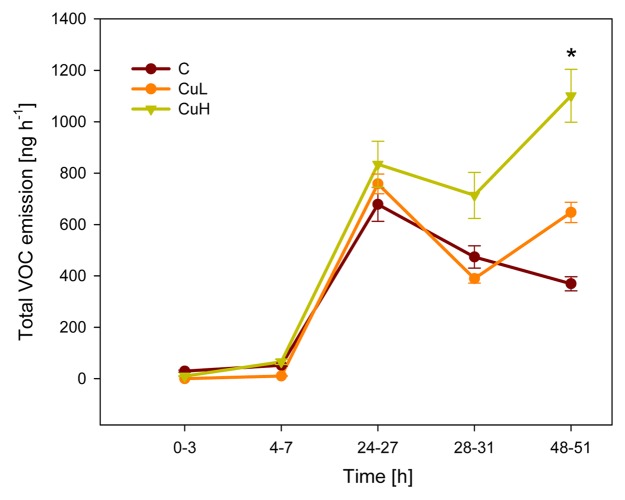
Figure 2. Kinetics of total emission of volatile organic compounds in response to herbivory. C, control plants grown without added copper; CuL, plants exposed to 10 µM Cu; CuH, exposed to 80 µM Cu. *p < 0.05, Repeated measures ANOVA after log-transformation. Symbols depict mean values (± SE), n = 6.

An official website of the United States government
Here's how you know
Official websites use .gov
A
.gov website belongs to an official
government organization in the United States.
Secure .gov websites use HTTPS
A lock (
) or https:// means you've safely
connected to the .gov website. Share sensitive
information only on official, secure websites.
