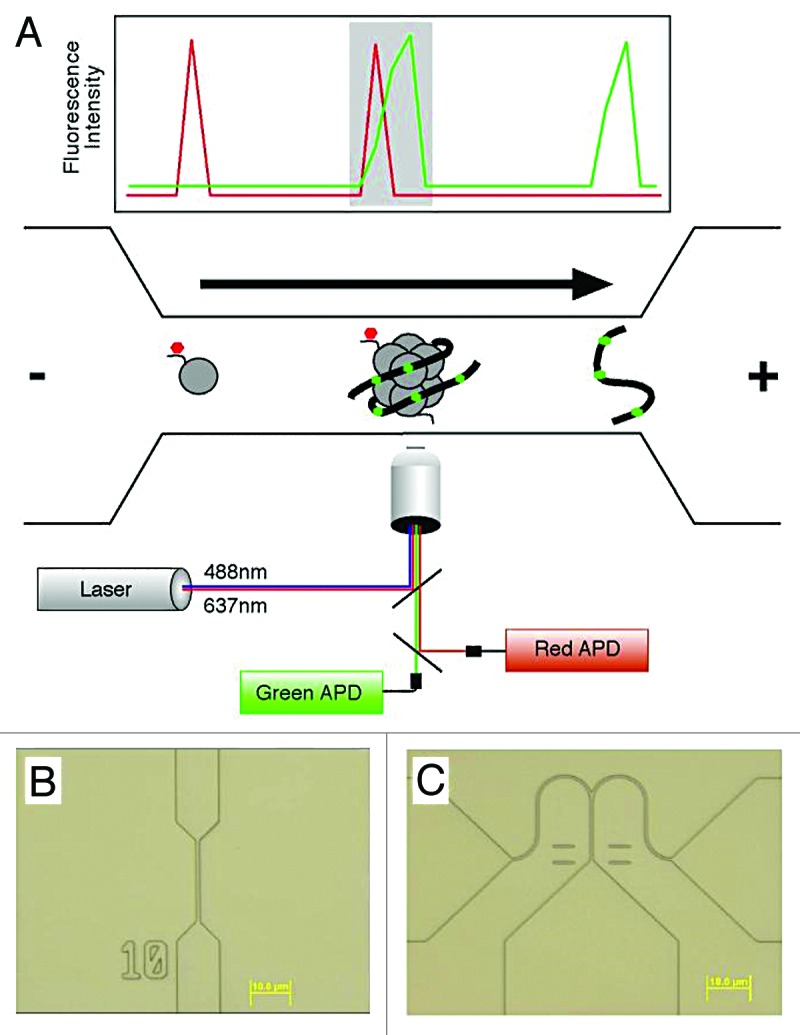
Figure 1. (A) A schematic diagram of a nanofluidic channel. The channel (bottom), fabricated in silica, consists of a microscale loading area (left), a 500 nm-wide constriction (middle) and a microscale outflow tract (right). Channel depth is 250 nm. An applied voltage drives DNA and chromatin through the channel toward the cathode as shown by the arrow. DNA is labeled with an intercalator (green), and chromatin modifications are detected by antibodies or other probes recognizing the modifications (red). Overlapping lasers illuminate the channel and define a 0.16 fL inspection volume. Light emitted by molecules occupying the volume is collected using a confocal microscope, and single photon detection is achieved using avalanche photodiodes (APDs). A graph representative of the collected data are shown above the channel. Single molecules are detected based on achieving a threshold of emitted photons relative to background. Intact chromatin fragments carrying epigenomic modifications of interest (shaded area) are identified by coincident detection of both a red and green single molecule. Recent changes in the optical design allow the use of 3 spectrally distinct lasers, enabling higher-order multiplexing and the detection of combinations of multiple epigenetic features. (B) A differential interference contrast optical micrograph of a typical nanofluidic channel used for enumerating epigenomic features. (C) Micrograph of a bifurcated nanofluidic channel designed to isolate individual molecules for subsequent analysis. The voltage bias is toggled between the 2 outflow tracts, controlled in real time based on the fluorescent properties of molecules as they pass through the inspection volume to achieve sorting.
