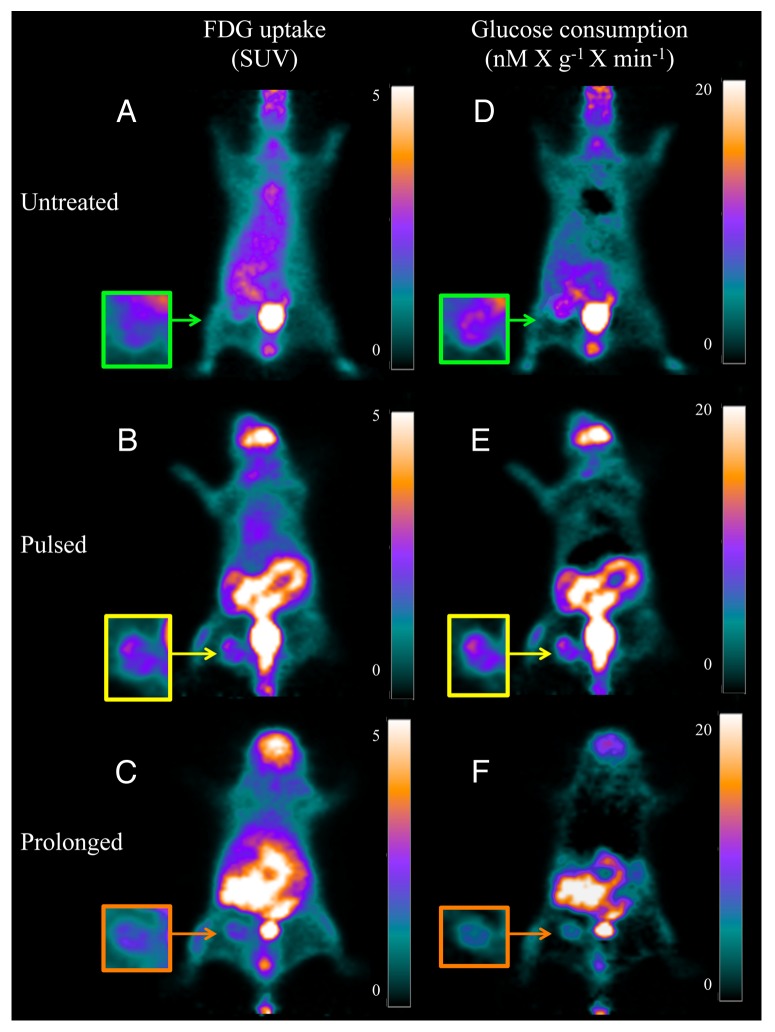
Figure 4. Coronal slices and enlarged tumor image of PET/FDG scans. (A–C) display the FDG uptake, documented in the last acquisition frame (from 40–50 min after injection), reproducing the usual representation of PET used in the clinical setting. Cancer uptake is visible and similar in all animals, regardless treatment protocol, as documented by the similarity of SUV reported in the color scale on the right side of each panel. (D–F) display the data of the same PET studies represented as glucose consumption (in nanomol × min-1-X g-1) as measured in each voxel by the product between the slope Patlak regression line and serum glucose concentration. This analysis shows reduced glucose consumption in cancer of the mouse treated for the whole study period.

An official website of the United States government
Here's how you know
Official websites use .gov
A
.gov website belongs to an official
government organization in the United States.
Secure .gov websites use HTTPS
A lock (
) or https:// means you've safely
connected to the .gov website. Share sensitive
information only on official, secure websites.
