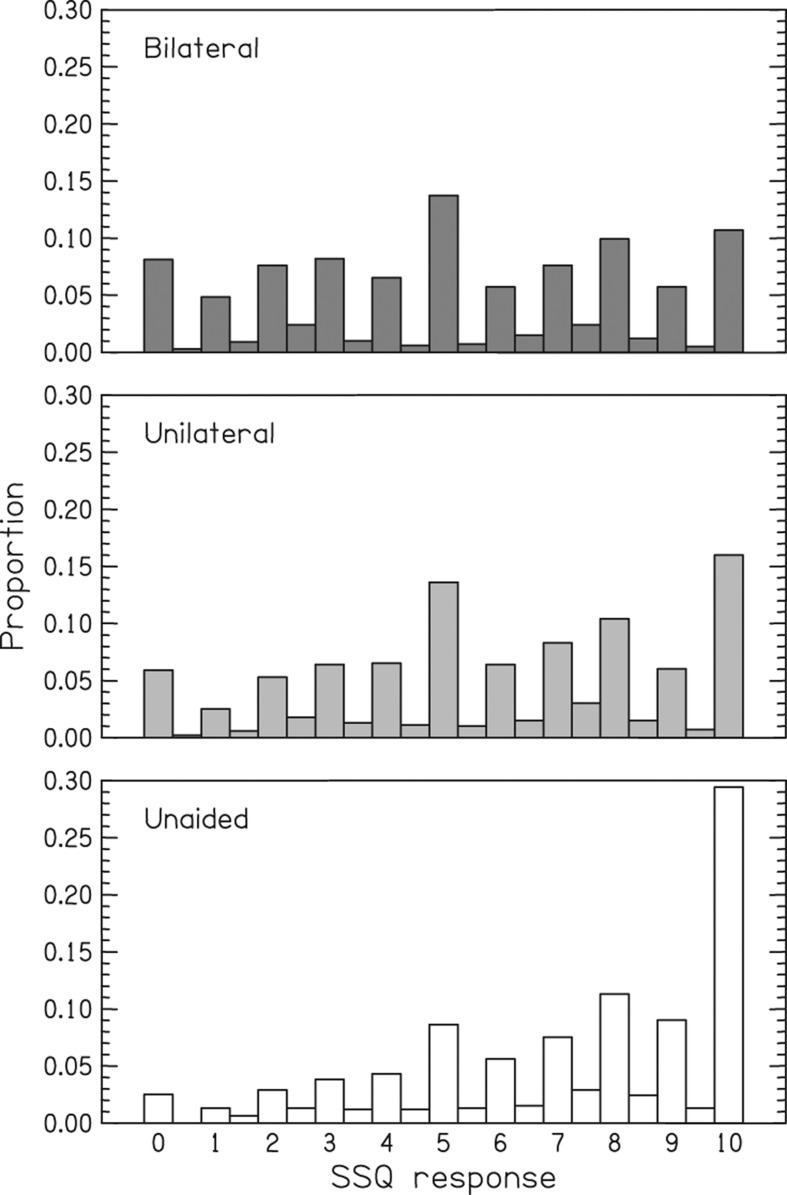
Figure 2.
Distributions of the responses to each possible point on the SSQ scale across all 1220 participants times 48 questions. The three groups are for unaided listeners (n = 386), unilaterally aided (n = 627), and bilaterally aided (n = 207). Any non-integer (or half-integer) responses have been rounded to the nearest integer (or half integer).

