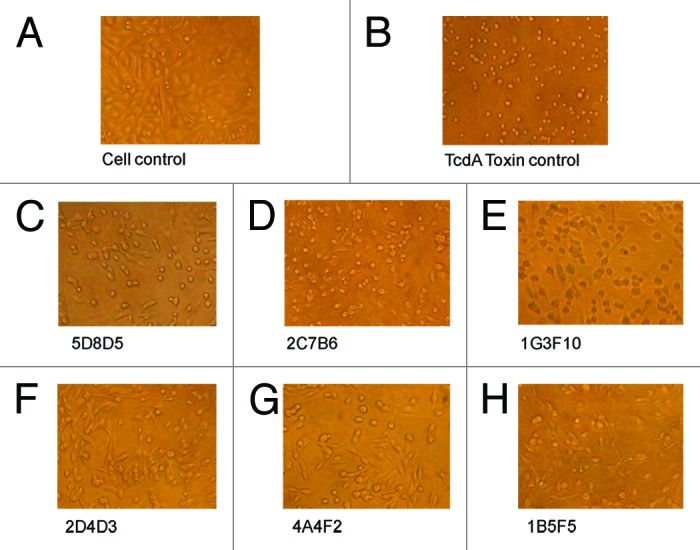
Figure 5. The neutralizing activities of TcdA-specific mAb measured by their protection against TcdA toxin in CHO cells. Light microscopic images of CHO cells with various treatments are shown: (A) “Cell control” lacks treatment by both TcdA toxin and mAb. (B) “Toxin control” is TcdA toxin without any antibody. (C–H) Cells were cultured with TcdA toxin with one TcdA mAb, as indicated under each panel. The mAb concentration was 15 µg/ml.
