
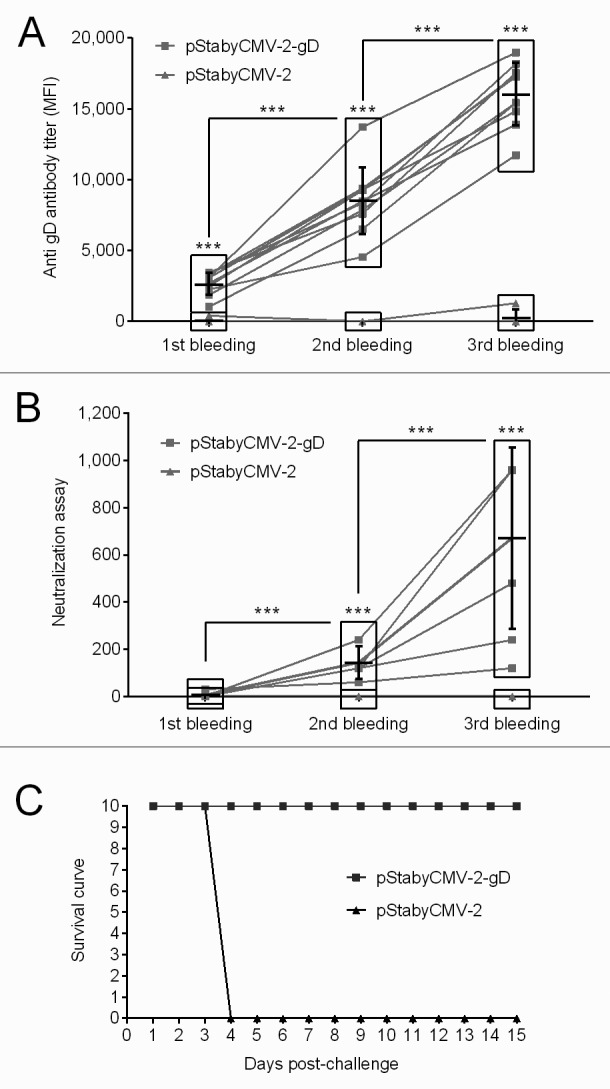
Figure 4. Evaluation of the immune response induced by pStabyCMV-2-gD in mice. (A) Specific antibodies raised against SuHV-1 gD were detected by indirect immunofluorescent staining of MAC-T cells transfected with pStabyCMV-2-gD using sample sera as primary antibodies. The MFI of labeled cells was measured by flow cytometry. (B) Neutralizing antibodies were quantified by complement independent neutralization assay. Symbol *** indicates statistical differences (p ≤ 0.01; paired Student’s t test; Graph Pad Software) observed for a specific time point between pStabyCMV-2-gD and pStabyCMV-2 groups (symbol above rectangle), or between different time points within the group of animals vaccinated with the pStabyCMV-2-gD. (C) Immunized animals were challenged with the Phylaxia strain. Time 0 represents the day of challenge.