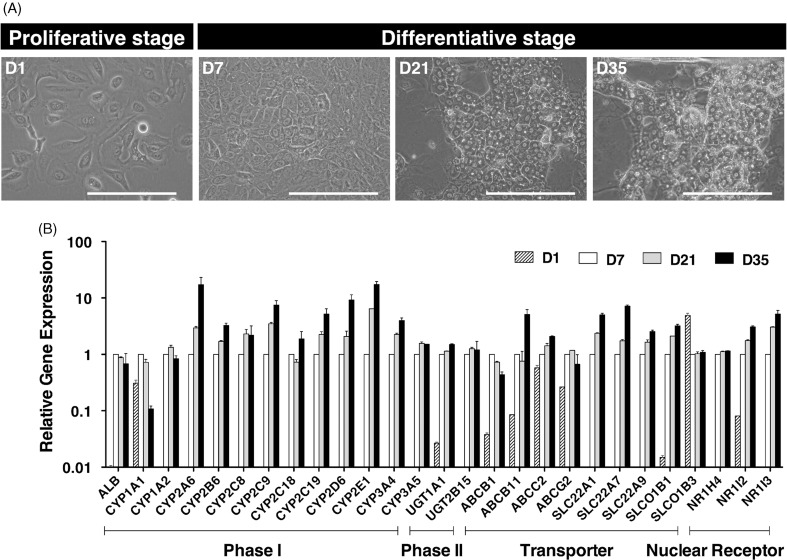
Figure 1.
In vitro differentiation of HepaRG® cells. (A) Phase-contrast photographs of HepaRG® cells at the proliferative stage (D1: low-density culture), and the differentiative stage (D7: confluent culture; D21 and D35: differentiation culture with 1.7% DMSO). D1, 7, 21 and 35 in HepaRG® stage indicate the number of days after seeding. Bar = 100 μm. (B) The relative expression of 26 human drug metabolism-related mRNAs on D1, 7, 21 or 35 in the HepaRG® cells was assessed by qPCR. Each bar represents the average of two independent determinations, and the standard error is shown.

