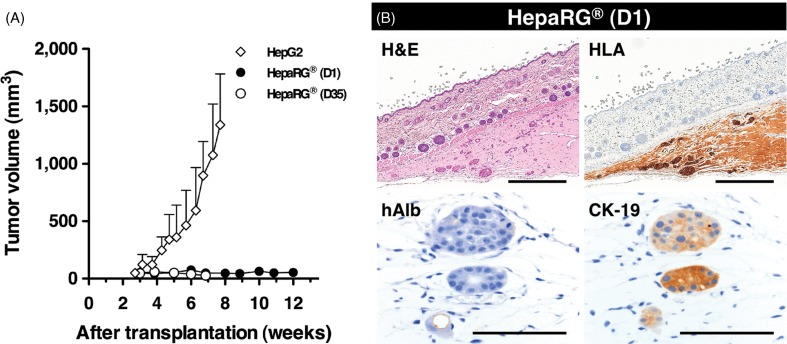
Figure 4.
Tumorigenic potency of HepaRG® cells in NOG mice. (A) The growth potential of HepaRG® cells was evaluated in NOG mice. A total of 1 × 10⁶ cells were subcutaneously transplanted into NOG mice. D1 and D35 in HepaRG® stage indicate the number of days after seeding. A total of 1 × 10⁴ HepG2 cells were used as positive control for s.c. transplantation. (B) Histologic and immunohistochemical analyses of D1 HepaRG® xenografts in NOG mouse. Twelve weeks after transplantation, the xenografts were processed for H&E staining, HLA, hAlb and CK-19 staining. Bar = 500 μm, Bar = 50 μm.

