
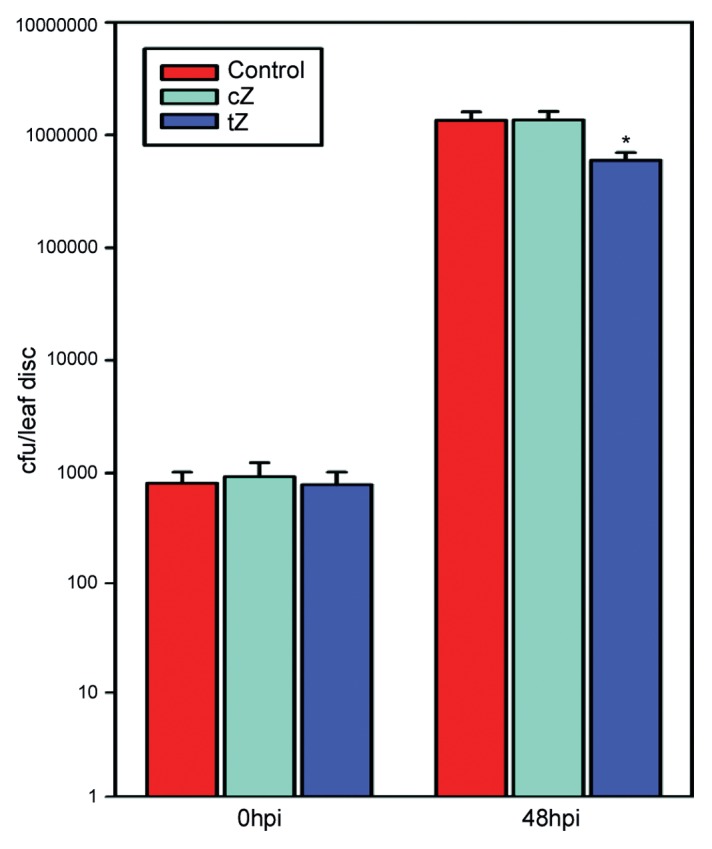
Figure 2.Pst growth in tobacco leaves after different pre-treatments 0 and 48 hpi. Mean values ± st. error of four independent biological experiments, consisting of three sets of three technical replicates each. *indicates significant difference to control and cZ treatment based on paired, two-sided Student’s t-test (p < 0.05).