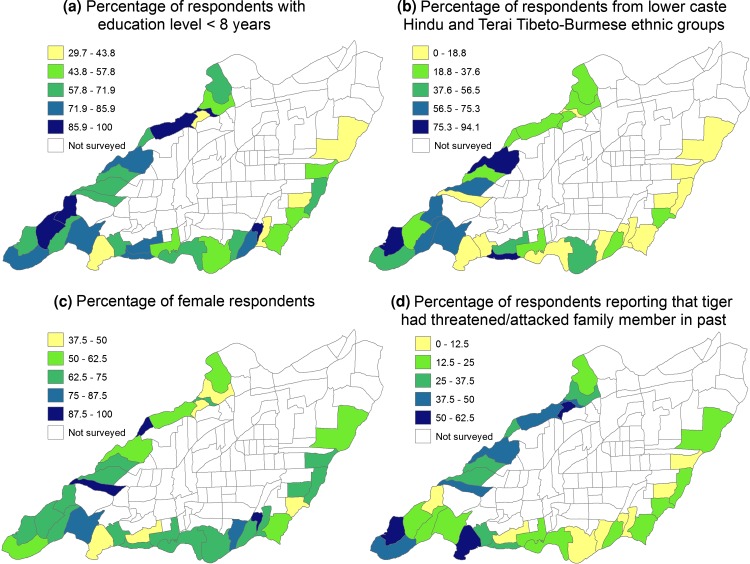
Fig. 2.
Maps showing percentage of respondents per ward that a had <8 years of education, b were from lower caste Hindu and Terai Tibeto-Burmese ethnic groups, c were female, and d reported that a tiger had threatened/attacked a family member in the past. Percentage categories were defined by equal intervals

