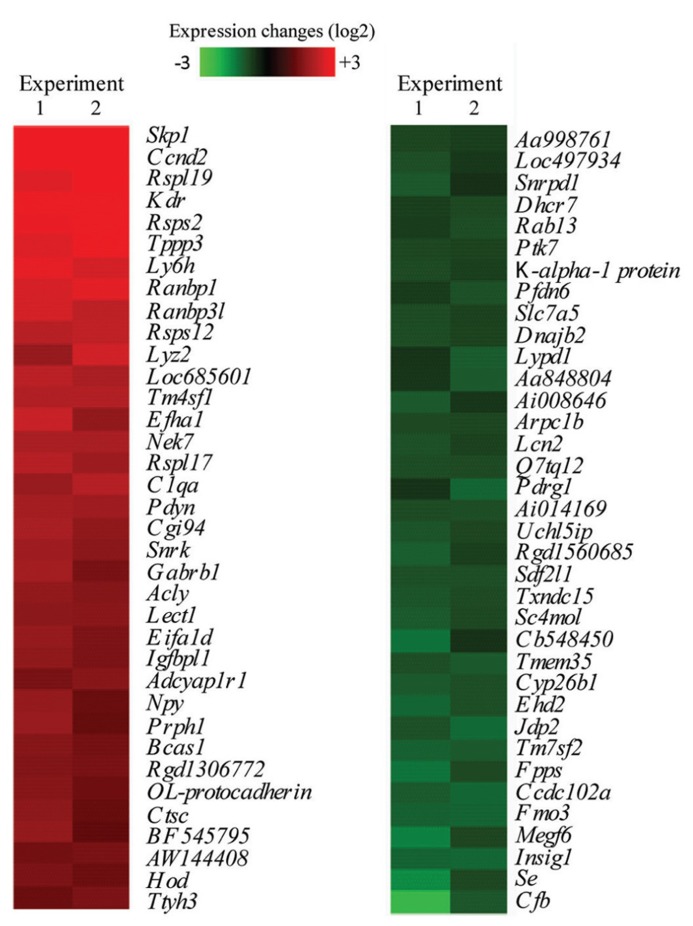
FIGURE 3.
Microarray analysis of strongest regulated neuron-responsive astrocyte genes. Shown are 36 of the most up – and down-regulated transcripts in astrocytes when co-cultured with neurons, which were subsequent removed by cold jet treatment (CC-CJ), compared to astrocytes cultured alone (AA-CJ). Each individual gene expression level was normalized (see methods) and plotted on a Log2 scale with red representing increased and green decreased mRNA levels in CC-CJ astrocytes compared to astrocytes cultured alone (AA-CJ).

