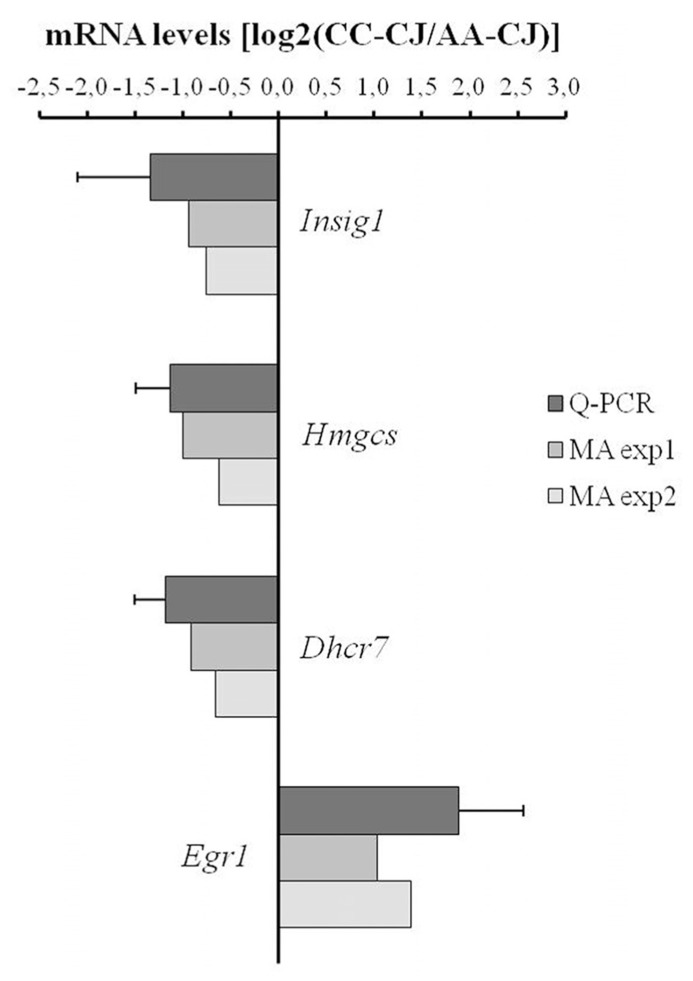
FIGURE 4.
Quantitative PCR analysis of neuron-responsive astrocytes genes. Transcript levels were measured using qPCR for a selected group of astrocyte-expressed mRNAs that according to microarray were neuron-responsive (in MA exp 1 and MA exp 2). The ratio between expression in CC-CJ vs. AA-CJ was calculated and plotted on a Log2 scale, e.g., expression of EGR1 was 3.7-fold higher in CC-CJ then in AA-CJ. Data represents the mean and SD of four samples.

