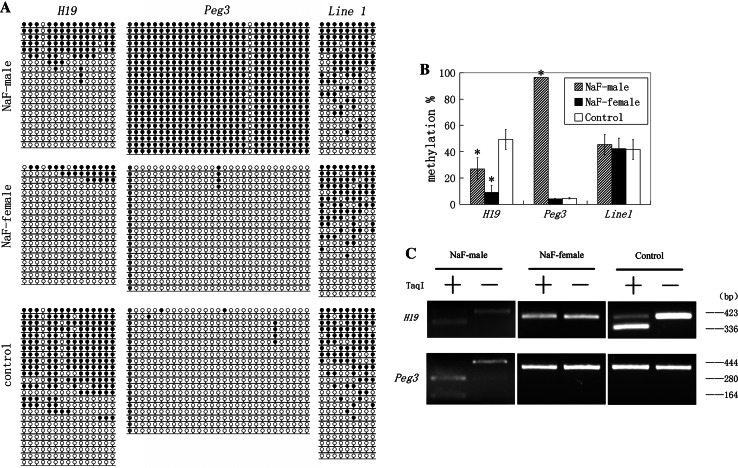
Fig. 1.
Methylation status of H19, Peg3, and Line1 in embryos in NaF-male, NaF-female, and control groups. NaF-male mice were given 100 mg/l NaF in water for 35 days. NaF-female mice with a vaginal plug were given 100 mg/l NaF in water for 48 h, after mating with male mice not exposed to NaF. Control animals did not receive NaF treatment. a Methylation profiles assayed by a bisulfite sequencing assay. Each line represents an individual clone allele. Each circle within the row represents a single CpG site (open and closed circles represent unmethylated and methylated CpGs, respectively). b Statistical analysis of methylation in three groups. Bisulfite sequencing (a) was used to plot the percent of methylated CpGs of the total number of CpG sites. Data are presented as mean ± standard error. (*p < 0.05, compared with controls). The same illustration was applied to the following figures. c Overall methylation profiles of H19 and Peg3 as revealed by bisulfite restriction analysis. The same bisulfite-treated DNA sample used for sequencing was digested with restriction enzymes. Restriction enzymes cleaved only if the recognized TaqI site is methylated. −, undigested PCR products; +, digested PCR products. Sizes of digested fragments are indicated on the right. Digestion of PCR products with TaqI enzyme produced cleaved and uncleaved products, suggesting that PCR products include methylated and unmethylated templates

