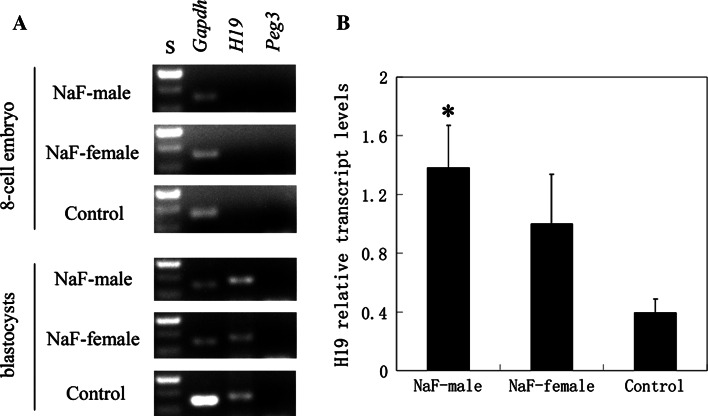
Fig. 2.
H19 and Peg3 expression in 8-cell embryo and blastocysts from NaF-treated and control mice. a Agarose gel electrophoresis. S, 100 bp ladders. b H19 relative transcript levels. Transcripts were normalized against the Gapdh control. Each column indicates the mean ± standard error (*p < 0.05, compared with controls)

