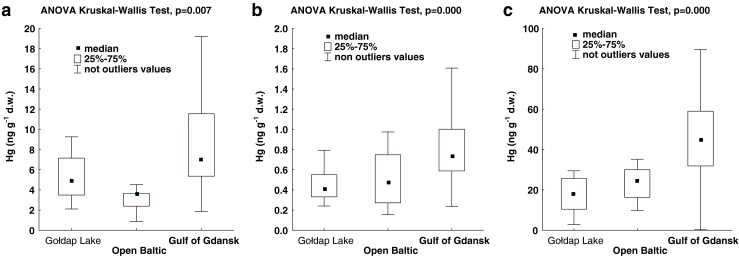
Fig. 3.

Regional variations of mercury concentrations in a styrofoam debris, b beach sand, and c moss (figure does not show outlying and extreme values)

Regional variations of mercury concentrations in a styrofoam debris, b beach sand, and c moss (figure does not show outlying and extreme values)