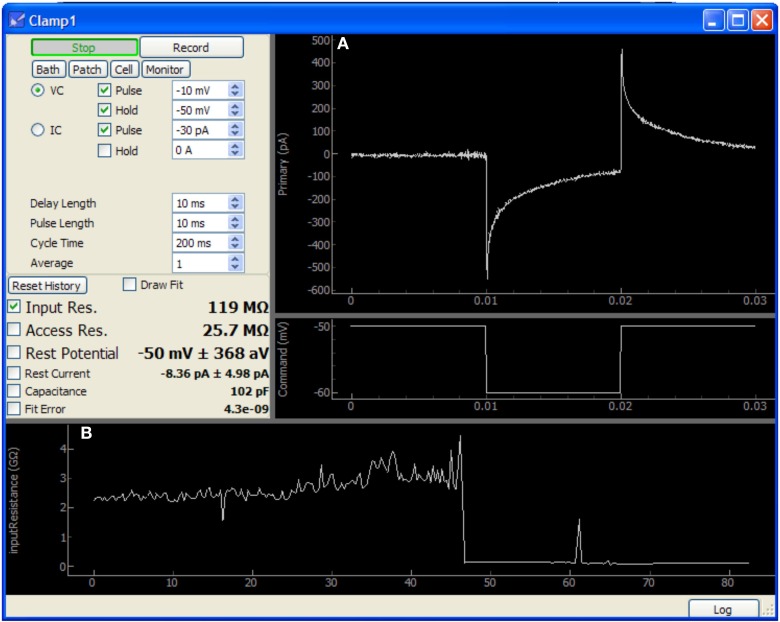
Figure 5.
Screen capture of the Patch module after patching a neuron in a mouse cochlear nucleus brain slice. In this image, approximately 40 s have passed since the membrane was ruptured to begin whole-cell recording. This data was acquired using only an NI-6259 acquisition board and a MultiClamp 700A amplifier. (A) Plots showing the voltage clamp recording and command waveform. This data is used by the module to determine the membrane properties shown at center-left (input resistance, access resistance, etc.). (B) Plot showing history of input resistance over the last 80 s. Maximum seal resistance and time of break-in are both recorded in this data.

