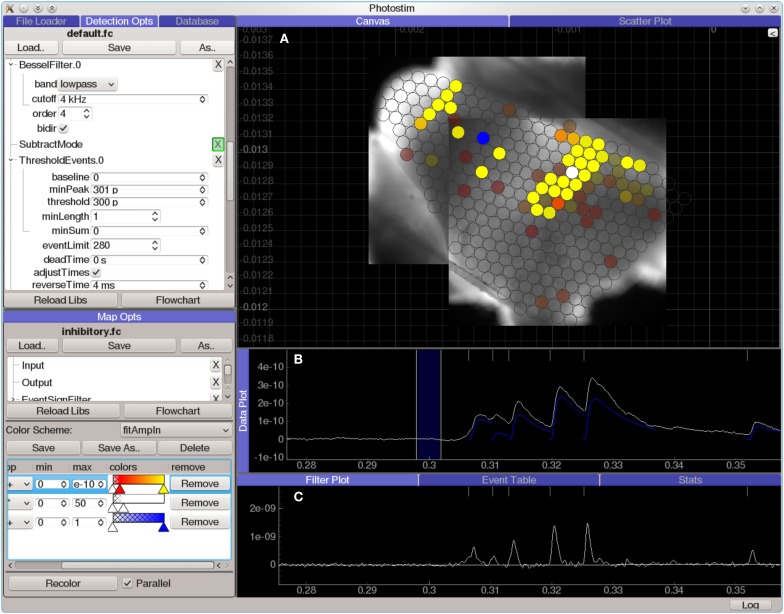
Figure 7.
Screen capture of the Photostim analysis module, processing laser-scanning photostimulation mapping using glutamate uncaging (300 μM MNI-glutamate) data from a mouse cochlear nucleus brain slice experiment. The hardware used to collect the data for this experiment is described in Figure 3. A Q-switched 355 nm DPSS laser was projected through scan mirrors to uncage glutamate at locations on the slice indicated by the displayed map results. (A) Analyzed results from a photostimulation map overlaid on images of the brain slice used in this experiment. Brightly colored circles indicate that a strong synaptic response was detected in the patched cell when the spot was photostimulated, whereas transparent circles indicate that no response was detected. (B) Plot of data from a single photostimulation recording. The traces in blue indicate the amplitude and time course of the evoked synaptic currents. (C) A diagnostic plot showing the same data at an intermediate filtering stage in which the onset of synaptic events has been detected.

