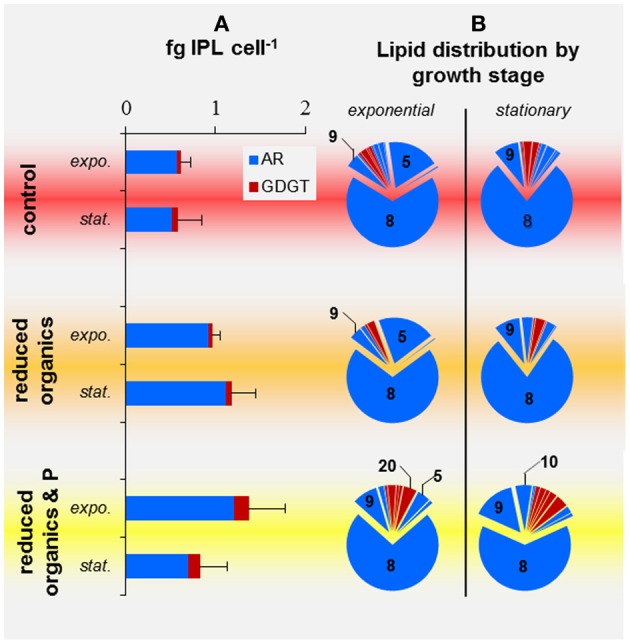
Figure 6.

IPL profiles of T. kodakarensis harvested at exponential or stationary phases from various media. (A) Cell quotas of AR (blue) and GDGT (red) IPLs; error bars represent standard deviation. (B) Relative abundance of IPLS; those that composed >5% are noted by the respective IPL number provided in Table 2.
