Figure 7.

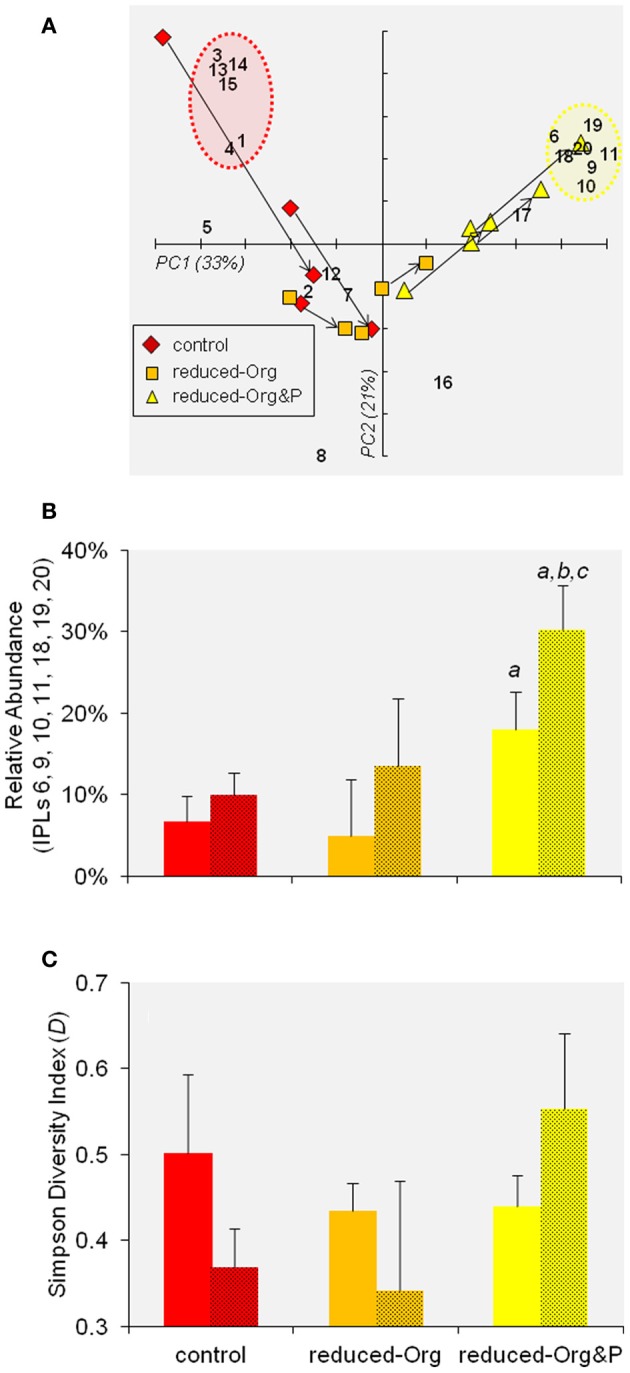
PCA of IPL distributions. (A) Biplot of PC1 and PC2 of IPL distributions in T. kodakarensis. The numbers refer to individual IPLs as described in Table 2. The arrows indicate the progression of cells from exponential to stationary phase within individual bioreactors. The red and yellow circles identify the clusters of IPLs that were relatively enriched in control or reduced-Org&P cells, respectively (refer to Section IPL Composition and Diversity). (B) The sum of the relative abundance of IPLs identified by the yellow circle in (A) are compared for cells harvested from various culture media at exponential (not shaded) and stationary (shaded) phases. The error bars represent standard deviation and the a, b, and c symbols represent significant differences (p < 0.05) relative to corresponding averages for control, reduced-Org media, and exponential harvests, respectively. (C) The average Simpson Diversity Index of T. kodakarensis IPLs harvested from the various culture media at exponential and stationary phases (as above); error bars represent standard deviation.
