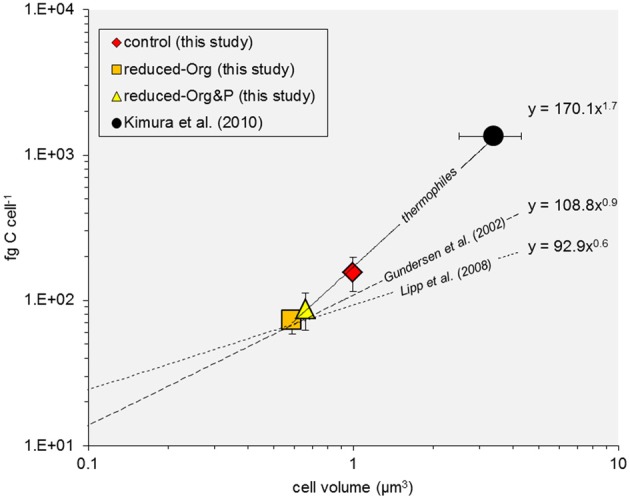
Figure 8.

Cell C:volume power function relationship. The relationship between measured and modeled values of cell C quota and volume are plotted for thermophiles (solid line), including data derived for T. kodakarensis (this study) and a thermophile community (Kimura et al., 2010), and compared to published data for bacteria and archaea (dashed lines; Gundersen et al., 2002; Lipp et al., 2008, after Simon and Azam, 1989).
