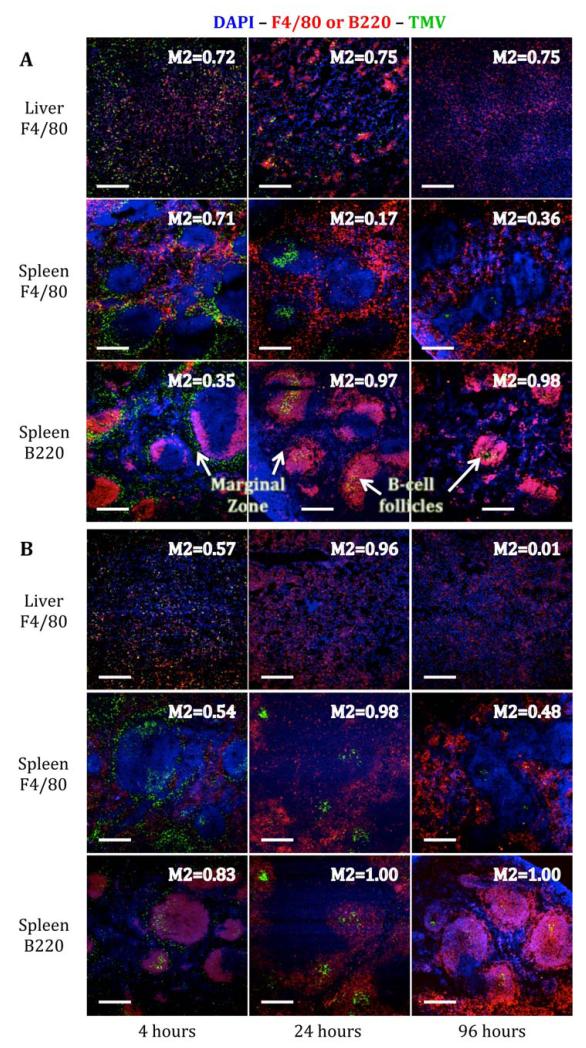
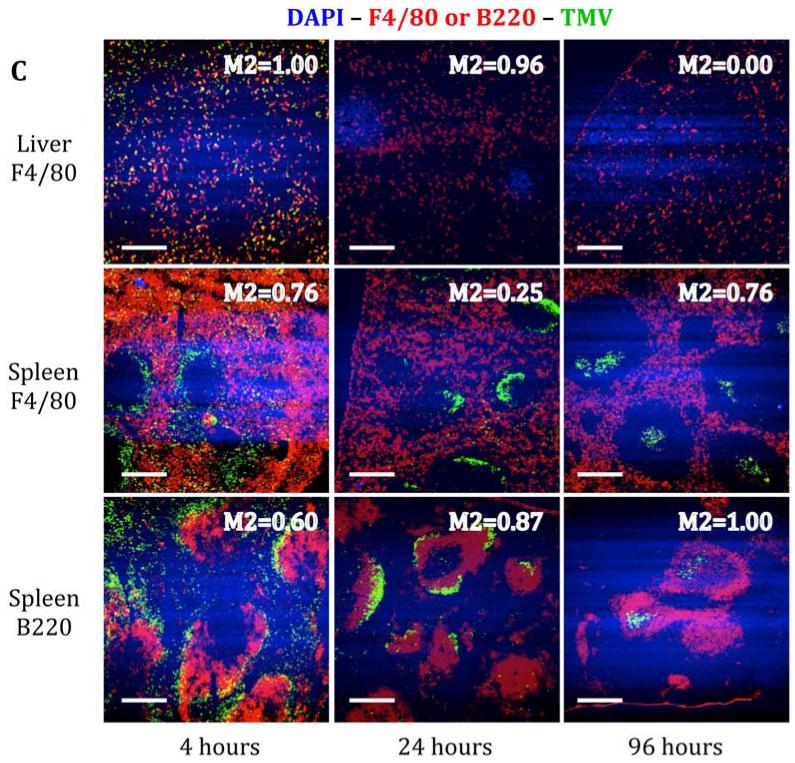
Figure 6.
Immunofluorescence imaging of liver and spleen sections 4, 24, and 96 hours after i.v. administration of (A) Cy5-TMV, (B) PEG-Cy5-TMV, and (C) Cy5-SNP (colored green). Liver sections were stained for macrophages marker F4/80 (red). Spleen sections were stained for B-cell marker B220 (red) and macrophage marker F4/80 (red). The marginal zone,and Bcell follicles are highlighted in the spleen sections (in A) for reference. Cell nuclei are stained with DAPI (blue). Inset into each image is the Manders’ M2 colocalization coefficient (M2=1.0 is attributed to 100% colocalization) Data were analyzed using ImageJ software. Scale bars = 250 μm.


