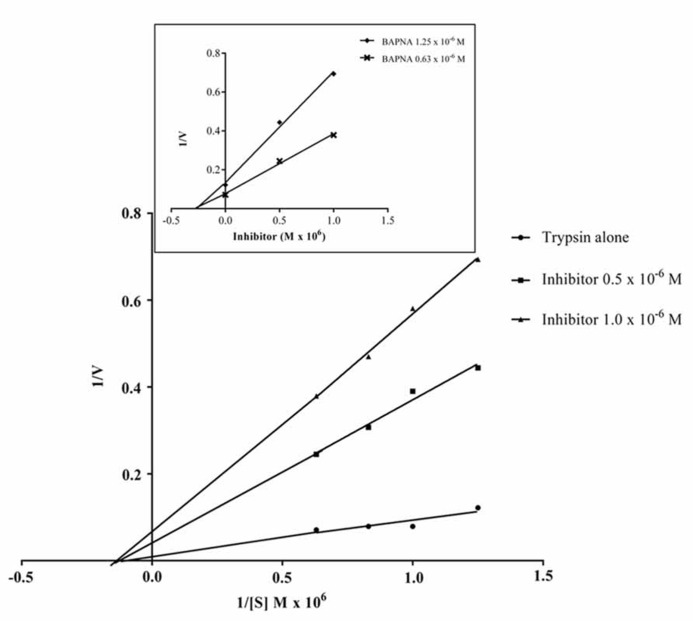
FIGURE 5.
Lineweaver–Burk plot (1/v × 1/[S]) of the inhibition of trypsin by JcTI-I, at two different inhibitor concentrations, in conjunction with the Dixon plot (1/v × [I], insert) for identification of Km, Ki and the likely mechanism of enzyme inhibition. Each point represents the mean of three estimates. The standard deviation was less than 10%.

