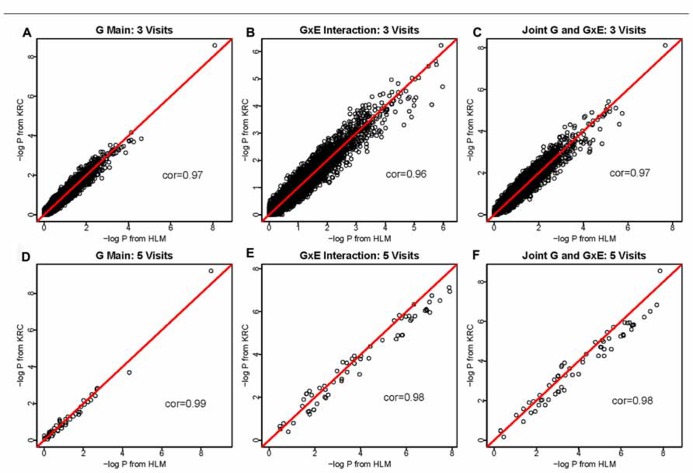
FIGURE 1.
-log(P) values using the HLM (x-axis) versus -log(P) values using the KRC (y-axis) for 3-visit and 5-visit data sets. Results from both methods were identical for 1-visit data (not shown). The 1st row corresponds to the 3-visit results (A for genetic main effects, B for GEI effects, and C for joint 2 df genetic and GEI effects). Similarly, the 2nd row corresponds to the 5-visits results (D for genetic main effects, E for GEI effects, and F for joint 2 df genetic and GEI effects).

