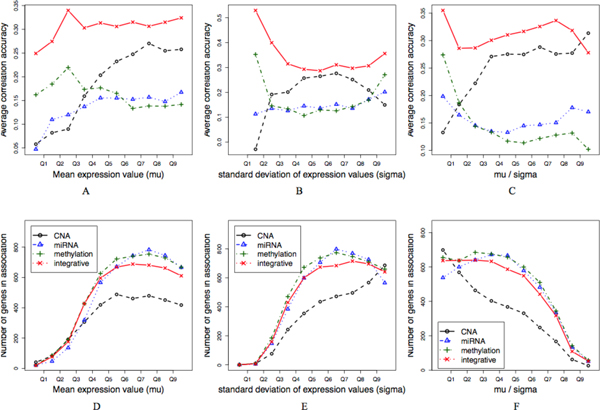
Figure 2.
Comparison of overall predictive power. The average prediction accuracy of the proposed integrative method is compared with those using each genomic feature type separately (A,B,C). Genes are first partitioned into 10 equal-sized bins according to their average expression levels, standard deviation, and the ratio of the two, respectively, and then the result is displayed as a function of these deciles. The number of genes in each bin having at least one genomic association is also displayed in D,E,F.

