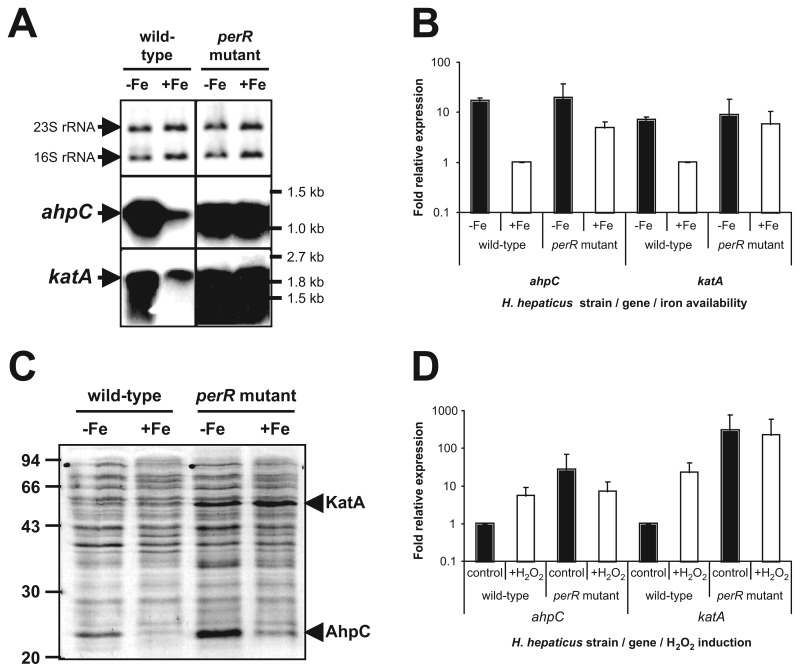
Fig. 2.
PerR controls iron-responsive repression and H2O2-responsive induction of ahpC and katA expression in H. hepaticus, as demonstrated by (A) Northern hybridization, (B) qRT-PCR, and (C) protein separation by SDS-PAGE analysis. (A) Northern hybridization of H. hepaticus total RNA isolated from cultures grown in iron-restricted (–Fe) and iron-replete (+Fe) conditions with specific probes for ahpC (middle panel) and katA (lower panel) is shown. The top panel displays a methylene blue staining of transferred rRNA, to show that equal amounts of RNA were loaded. The positions of the 16S and 23S rRNA are indicated on the left and relevant marker sizes on the right. (B) qRT-PCR analysis of ahpC and katA transcript levels after overnight growth of H. hepaticus wild type strain and perR mutant, in either iron-restricted medium (black bars, –Fe) or iron-replete medium (white bars, +Fe). The levels of mRNA were calculated from the Ct-value observed in the qPCR reaction, after normalization to the levels of 16S rRNA [29], and are expressed relative to wild-type transcript levels in iron-replete medium, which was set to 1. Error bars represent standard deviations, from two biological replicates. (C) Total protein of H. hepaticus ATCC 51449 and perR mutant, grown in iron-restricted medium (–Fe) and iron-replete medium (+Fe), was separated by SDS-PAGE and stained using Coomassie Brilliant Blue. Relevant marker sizes are indicated on the left. The protein bands identified as the H. hepaticus KatA and AhpC proteins by MALDI-TOF analysis are indicated on the right. (D) qRT-PCR analysis of ahpC and katA transcript levels after a 15-min incubation of H. hepaticus wild type strain and perR mutant without H2O2 (control) or with 100-µM H2O2 (+H2O2). The levels of mRNA observed in the qRT-PCR were normalized to the levels of 16S rRNA [29], and expressed as relative to wild-type transcript levels without exposure to H2O2, which were set to 1. Error bars represent standard deviations, from two biological replicates

