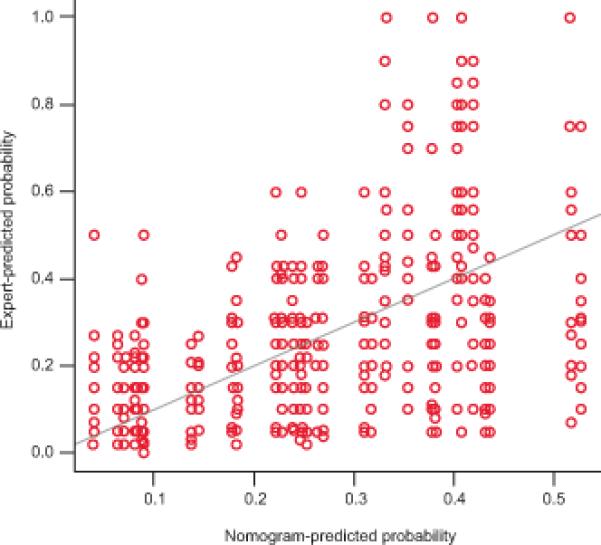
Figure 5.

Scatter plot of the models’ predicted probabilities against the experts’ predicted probabilities. The solid diagonal line indicates perfect agreement between predictions. Experts’ predictions demonstrate increased variability as the model's predicted probabilities increase. For example, at predicted probabilities of De novo stress urinary incontinence (SUI)between 30%–50% the range of the experts’ predicted probabilities was highly variable and ranged from 0% to 100%.
