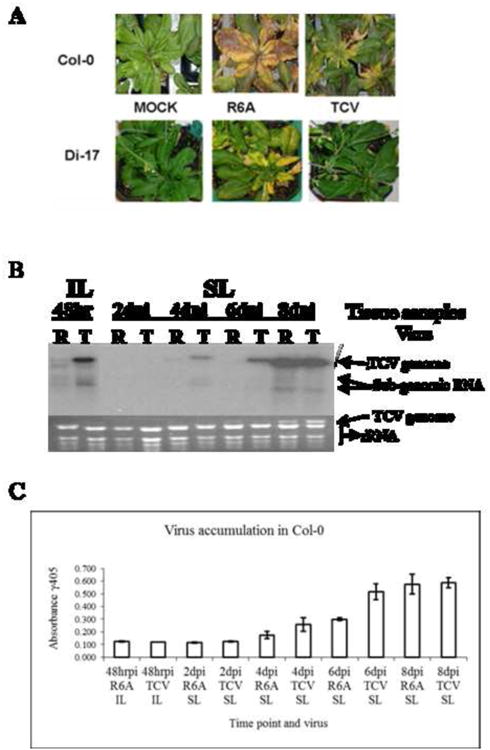
Figure 1. Symptoms and virus accumulation of TCV and the R6A mutant in Arabidopsis thaliana.

(A) Symptoms in susceptible Col-0 (top) and resistant Di-17 (bottom) at 14 days after inoculation (dpi). (B) Northern blot showing accumulation of viral RNAs of wt TCV (T) or mutant R6A (R) in inoculated leaves (IL) at 48 hr post inoculation (hrpi) and systemic leaves (SL) at 2, 4, 6, and 8 day post inoculation (dpi). The probe was specific for CP sequence as described in Materials and Methods. Arrows identify location of viral genome (vRNA) and subgenomic RNAs (sgRNA). The ethidium bromide (EtBr) stained gel is shown below as a loading control. Representative of three repeated experiments. (C) Virus particle accumulation measured by ELISA in inoculated (IL) and systemic leaves (SL) of A. thaliana ecotype Col-0 over the time course. Error bars represent standard deviation from the absorbance levels of ELISA readings for three independent experiments. Background reading of 0.200 OD units was subtracted as background.
