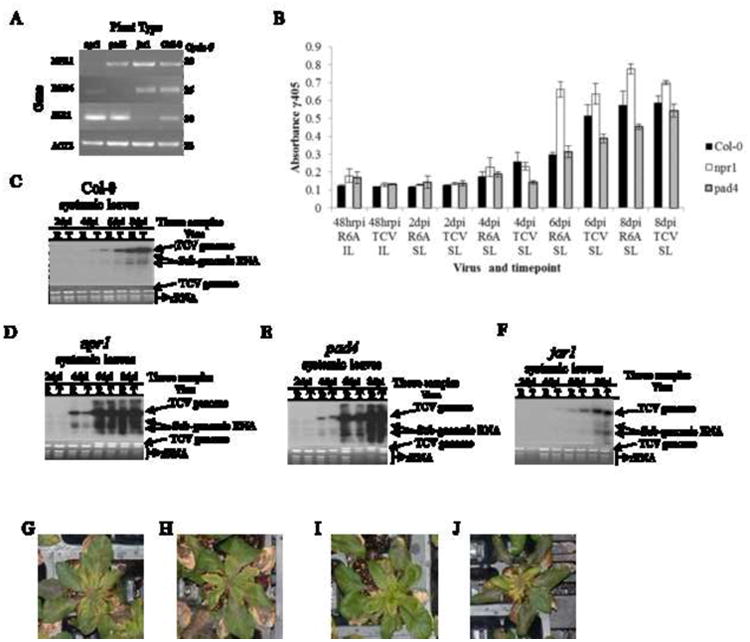
Figure 2. Comparison of TCV and R6A accumulation in Arabidopsis lines with compromised defense pathway signaling responses.

(A) PCR analysis confirming the absence of NPR1, PAD4, JAR1 and EIN2 in various knockout lines of Arabidopsis thaliana. Actin 2 was used as a control. The number of PCR cycles for each gene is shown on the right. Primer sequences are shown in Table 1. (B) Northern blots showing accumulation of viral RNAs of wt TCV (T) or mutant R6A (R) in systemic leaves (SL) at 2, 4, 6, and 8 day post inoculation (dpi) as described in Fig. 1. The panels show accumulation in each of the specific knockout lines identified in panel A. This experiment was repeated 3 times with similar results. (C-E) Virus particle accumulation measured by ELISA in inoculated (IL) and systemic leaves (SL) of the NPR1, PAD4 and JAR1 KO lines. Error bars indicate standard deviation for 3 independent experiments. (G-J) NPR KO lines at 12 dpi, infected with TCV (G) or R6A (H). PAD4 KO lines at 12 dpi infected with TCV (I) or R6A (J).
