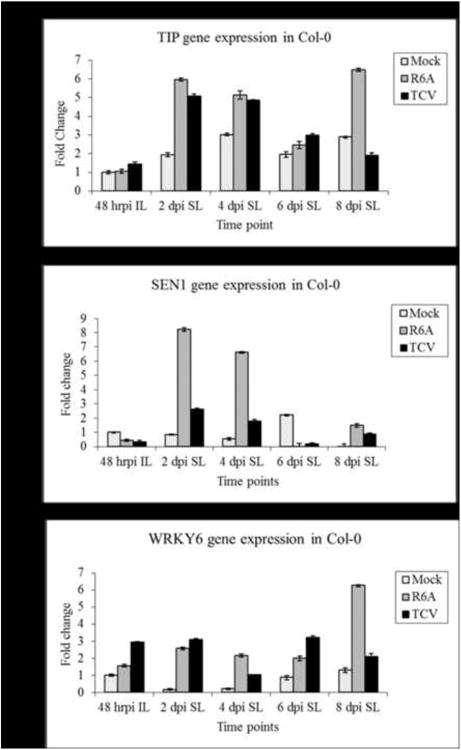
Figure 3. Comparison of expression of defense related genes in TCV and R6A infections over the time course of infection using Real-time PCR.

A. thaliana ecotype Col-0 was inoculated with either TCV or R6A transcripts and total RNA was extracted for each time point and analyzed using One-step Real-time PCR as described in Materials and Methods. The relative fold change of (A) TIP, (B) SEN1 and (C) WRKY6 are plotted. Fold change is calculated relative to the mock infection for each gene at 48hrpi. ACT2 was used as the endogenous control. This graph is the average of results obtained for 2 independent experiments.
