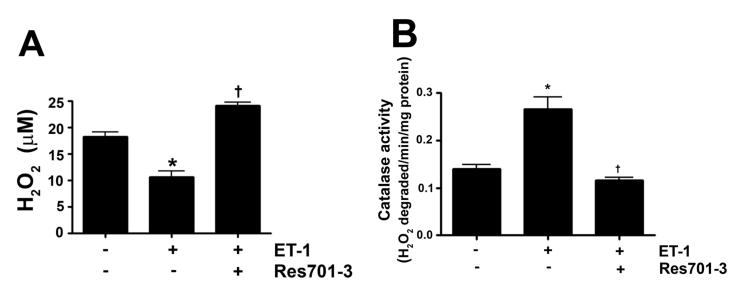
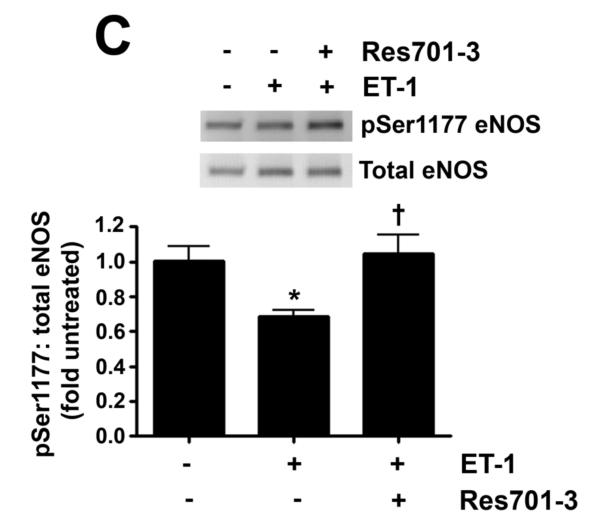
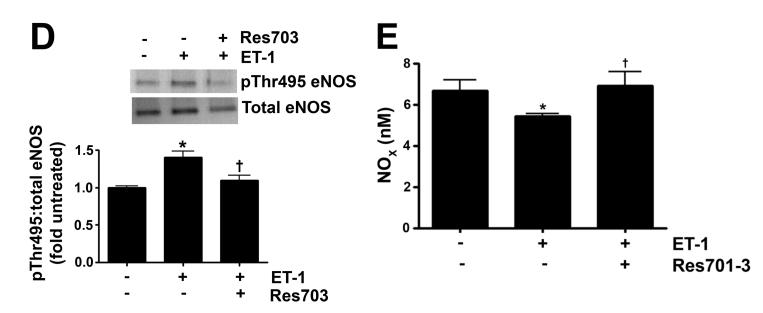
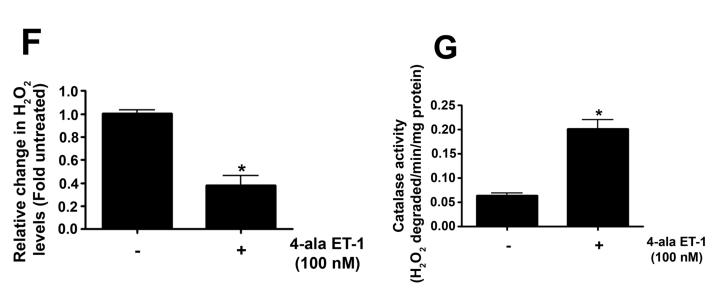
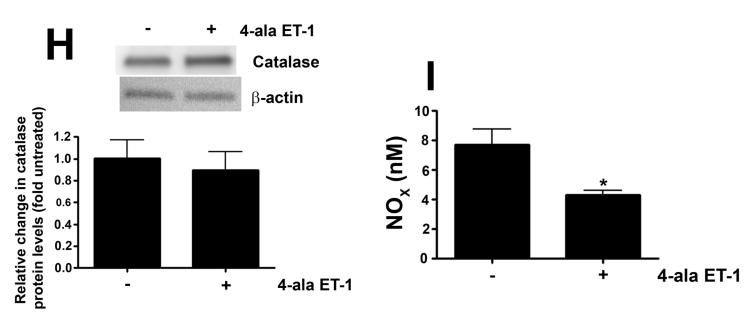
Figure 3. ET-1 treatment decreases H2O2 levels and NO generation via ETB receptor signaling.
PAEC were exposed to ET-1 (100nM, 4h) in the presence or absence of the ETB receptor antagonist Res701-3 (10μM). The media was used for the measurement of H2O2 and NO levels. The cell lysate was then used for determination of the pSer1177- and pThr495-eNOS, total eNOS, catalase activity and catalase protein levels. ET-1 decreased H2O2 levels (A), and increased catalase activity (B, H2O2 degraded/min/mg protein). ET-1 also decreased pSer1177 eNOS levels (C) but increased the level of pThr495 eNOS (D) as determined by Western blot analysis. NO generation was also decreased with ET-1 treatment (E). The ETB receptor antagonist, Res701-3 blocked all of these effects (A-E). PAEC were also treated with the ETB receptor agonist, 4-ala ET-1 (100nM, 4h). H2O2 levels decreased with 4-ala ET-1 treatment (F) while catalase activity (H2O2 degraded/min/mg protein) increased (G). Catalase protein levels did not change (H). NO levels were also decreased by 4-ala ET-1 (I). Data are mean± SEM; n =4-6. *P <0.05 vs. untreated, †P <0.05 vs. ET-1 alone.

