
Figure 2. LPC NPs exhibited high toxicity and strong transport ability of CDDP.
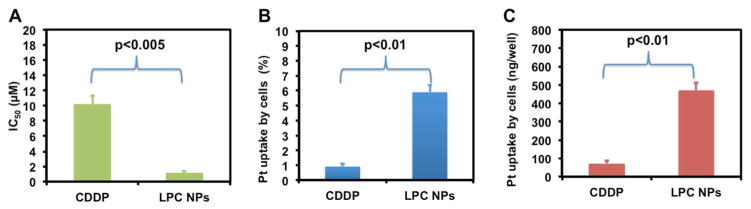
(a) IC50 of CDDP and LPC NPs in A375M cells. (b) The amount of cell uptake of CDDP and LPC NPs in A375M cells quantified using ICP-MS. Data is expressed as % uptake. (c) The amount of the Pt drug associated with cells after incubation with 100 μM CDDP or LPC NPs in 24 well plates. Each bar represents the mean ± SEM of 3 independent experiments. The analysis of variance is completed using a one-way ANOVA.