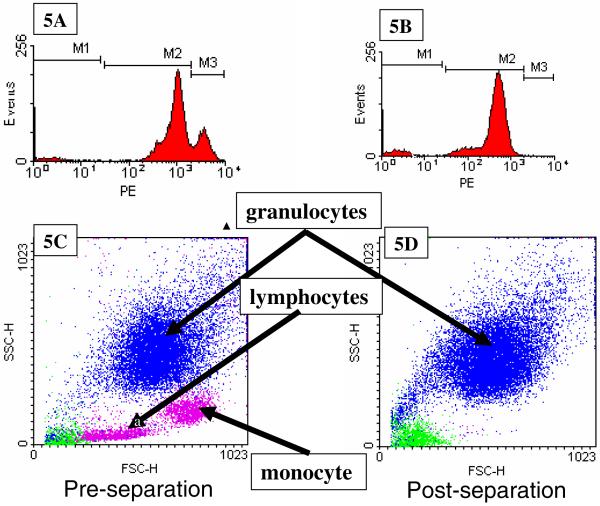
Figure 5.
Flow cytometry analysis of one of the cancer patient blood samples, labeled with Protocol A, prior to (5A, 5C), and after (5B and 5D), immunomagnetic cell separation. 5A and 5B are histograms of PE expression of cells labeled with an anti-CD45-PE, and 5C and 5D are dot plots of forward scatter of the cell sample prior to and after separation. Based on the three gated regions, M1, M2, and M3, in 5A and 5B, the “dots” in 5C and 5D are color coded corresponding to M1 (green), M2 (blue), and M3 (magenta).

